USC Sea Grant Interns Create New Maps for Urban Tides Program
USC Sea Grant is excited to share the results of a year-long internship with USC Students Phoebe Moffett and Tricia John. Over the past year (from Fall 2020 through Spring 2021 semesters) Phoebe and Tricia’s internship included creating maps for the USC Sea Grant Urban Tides Program. This program encourages local community members to visit the Southern California coast during extreme tide events and to take pictures of the beach and coastline throughout the year to document changes, especially during king tides (over 6 feet).
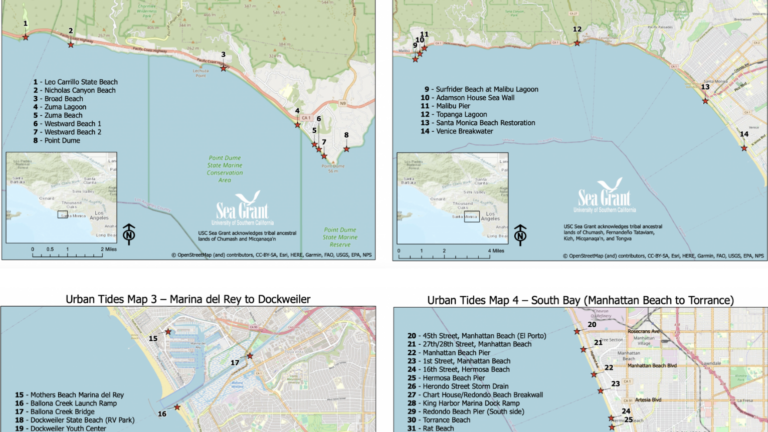
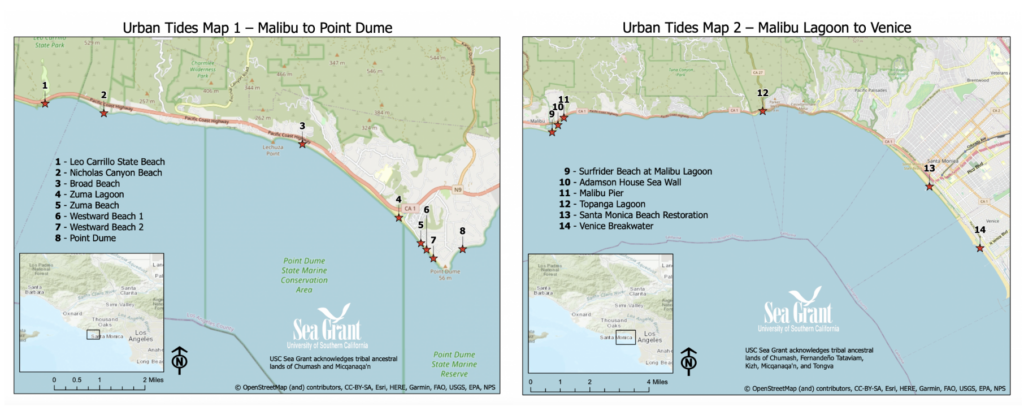
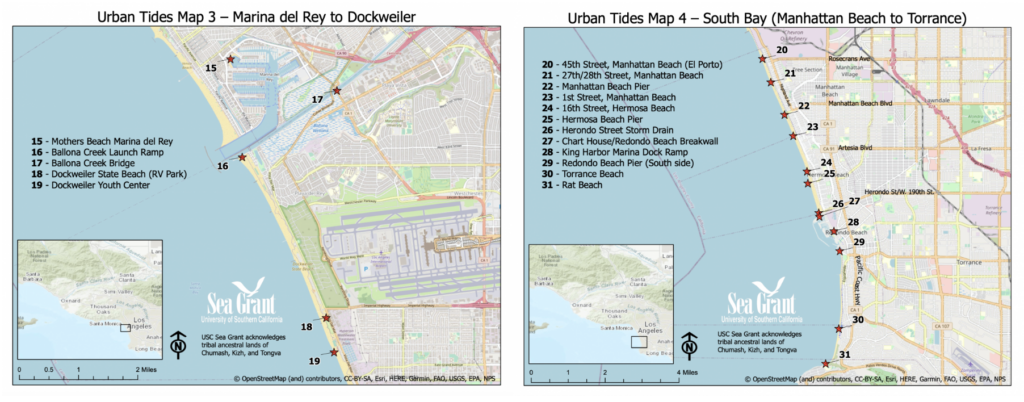
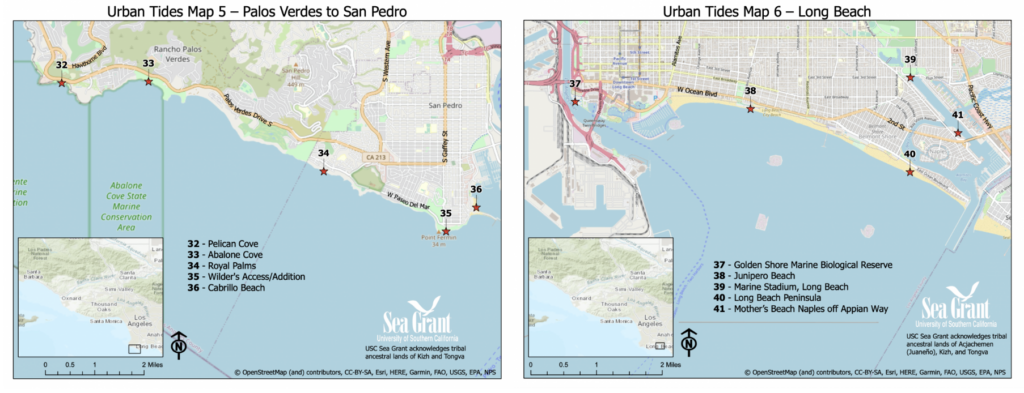
To help guide the community members to points of interest, Phoebe and Tricia created six maps in ArcGIS Pro along the Los Angeles County coastline that highlight beaches and locations that people can document during their beach visits. Each map is split up by geographic areas ranging from Malibu to Long Beach. The locations include Malibu to Point Dume, Malibu Lagoon to Venice, Marina del Rey to Dockweiler, Manhattan Beach to Torrance, Palos Verdes to San Pedro, and Long Beach. Each map includes directions to the beaches as well as the desired orientation for photos and accessibility. These maps are displayed on the Urban Tides Program website for community members to access in hopes of providing yearlong guidance on how to easily participate in the program. The maps are provided in PDF form in color and also in black and white printable options.
View a PDF of the 6 maps here, or in B&W printable version here. Examples of what these two products look like are provided below.
Guidance Maps for Los Angeles County
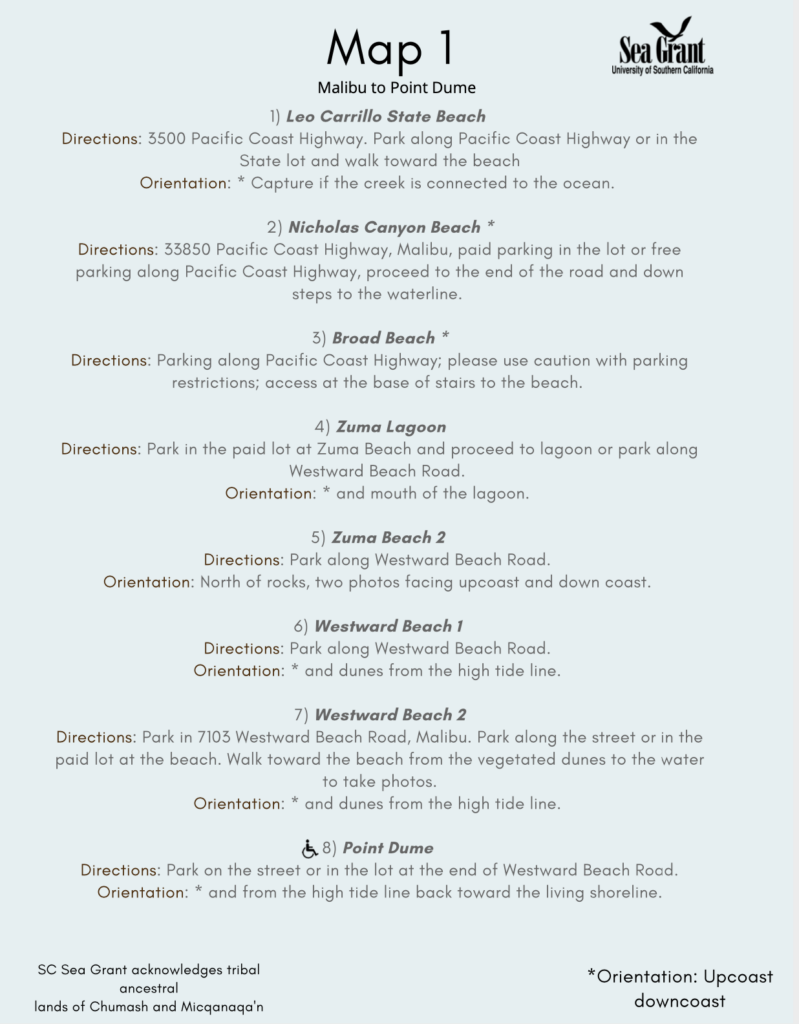
Map Instructions
Below is an example of the instructions that accompany each map, in this case, for Map 1. Each map includes an instructions pamphlet providing directions to the beaches as well as the desired orientation for photos and accessibility.
Urban Tides Story Map
Further, to educate the community on this program and address common issues and questions, Phoebe and Tricia created an ArcGIS Story Map. The story map breaks down the Urban Tides project and why it is important, includes a map of the current database where community submissions can be viewed, and provides current tide information and helpful resources.

Resources
- To learn more about the Urban Tides Community Science Initiative, click here.
- To view the Urban Tides Story Map, click here. Within this map, you can find information on directions for how to contribute to a photo and how to find your local tide information.
- To view this information on its own, view printable guidelines on how to take and submit your photos and/or view how to find your local tide information.