Voter confidence in Trump’s mental and physical fitness drops after first debate while confidence in Biden grows
Could President Donald Trump’s reelection campaign be better off because this week’s debate isn’t happening?
A new analysis of data from the USC Dornsife College of Letters, Arts and Science’s Daybreak Poll reveals voters of all political ideologies thought that Trump performed far worse in the first presidential debate than former Vice President Joe Biden did relative to their expectations for each candidate. And in the days after the debate, voter ratings for Trump’s mental and physical fitness dropped, while Biden’s improved.
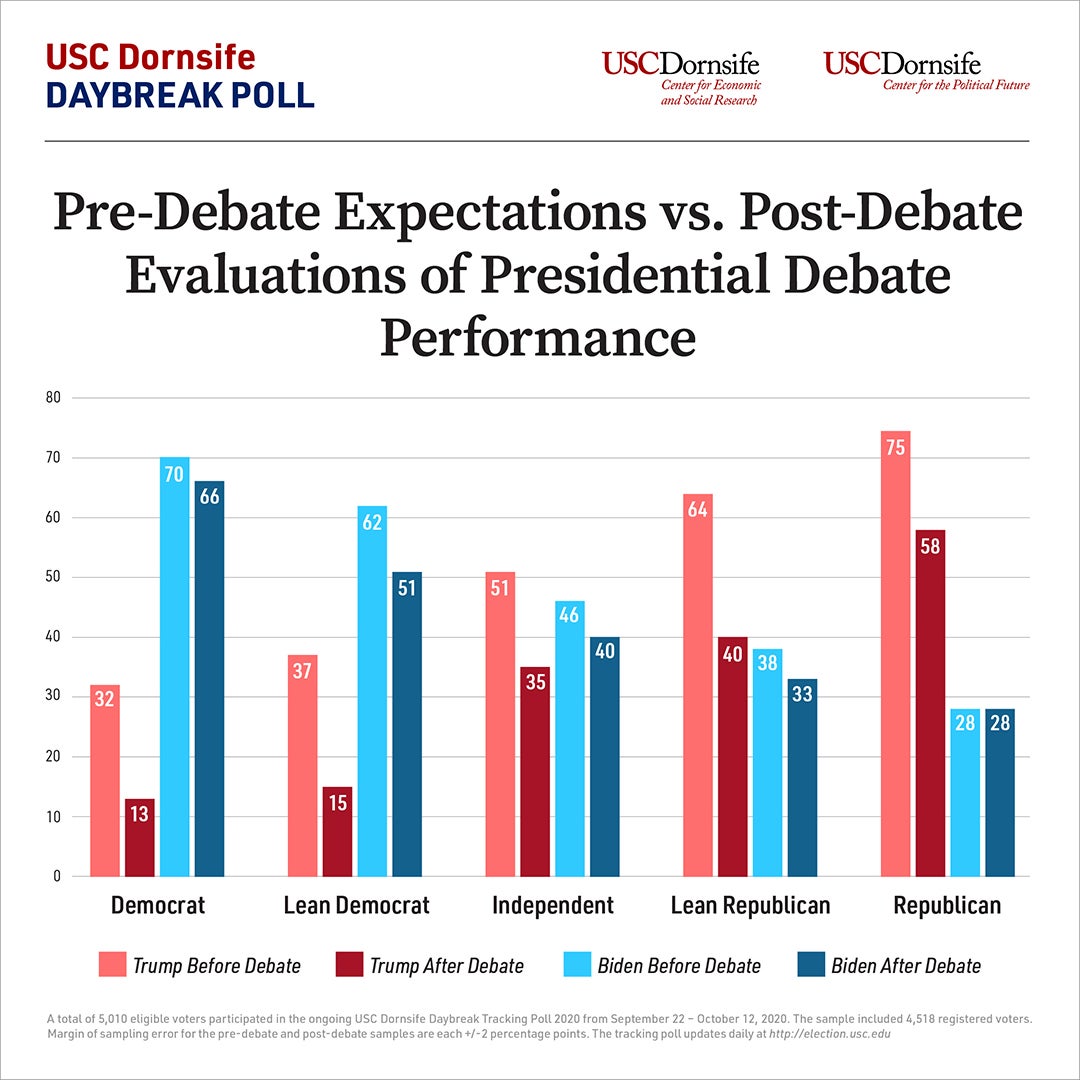
Before the Sept. 29 debate, Daybreak Poll panelists were asked to rate their expectations for Trump’s and Biden’s performances on a scale of 0 to 100. Pre-debate expectations were nearly identical: 51 for Trump and 50 for Biden. Post-debate performance ratings show that neither candidate met the relatively low expectations of voters overall, but Trump significantly underperformed.
From pre-debate expectations, voter ratings of Trump’s performance plunged to 33 — a drop of 18 points — while Biden remained closer to expectations at 46.
Voters of every political ideology thought Trump significantly underperformed, but particularly independents who lean Republican. The rating for Trump’s debate performance among that key demographic dropped 24 points from pre-debate expectations, while Biden’s rating dropped 5 points. The margin that separates their post-debate scores of 40 and 33, respectively, is surprisingly small for ratings by Republican-leaning voters.
Biden’s post-debate rating among Democratic-leaning independents dropped 11 points for a score of 51. Among independents who don’t lean toward either party, Trump was the candidate who disappointed voters the more. His rating dropped 16 points while Biden’s dropped 6.
“Few presidential debates make that much difference. This one apparently did,” said Bob Shrum, director of the USC Dornsife Center for the Political Future. “In the eyes of voters, Donald Trump belly-flopped into an empty swimming pool. The first, and perhaps only, 2020 debate may in the end do more to shape the ultimate outcome of the race than any debate since the first Kennedy-Nixon face off in 1960.”
Mental and physical fitness ratings
Which candidate is more mentally fit to be president? Before the debate, voters perceived Biden’s mental fitness to be better than Trump’s. Following their matchup, Biden’s ratings improved while Trump’s worsened.
Prior to the debate, Biden had a net positive rating of 7 points on the question of his mental fitness; that is, 46% of voters thought he was mentally fit while just 39% saw him as unfit. Following the debate, the former VP’s net rating improved 4 points.
Trump, on the other hand, had a net negative rating of 5 points (42% fit to 47% unfit) before the debate, and that worsened by 3 points afterward.
On the question of their physical fitness to be president, both candidates had net positive ratings prior to the debate, but Trump’s large advantage on this issue shrank considerably after their Cleveland, Ohio, faceoff. Trump was diagnosed with COVID-19 and spent several days in the hospital during the poll’s post-debate period, which had the potential to impact ratings of his physical fitness among those who responded to the poll after his diagnosis.
Pre-debate, the president had a net positive rating on his physical fitness of 29 points, slightly more than double Biden’s net positive rating of 14 points. After the debate, Trump’s net rating worsened by 8 points (52 fit to 31 unfit) while the former vice president’s improved 8 points (48 to 26).
Biden’s lead in the national popular vote is 13 points (54% Biden to 41% Trump), up from his pre-debate advantage of 10 points.
The former vice president has gained the support of 9% of those who voted for Trump in 2016 while 5% of those who voted for former Secretary of State Hillary Clinton plan to vote for Trump this November.
Those who voted for a third-party candidate in 2016 favor Biden over Trump by 11 percentage points.
Election trust and voting methods
Using a scale of 0 to 100, the panel of voters were asked to rate their confidence that their vote will be counted. This month’s average confidence level of 70 is largely unchanged from last month’s 71. Biden voters have the most trust that their votes will be counted (75), followed by Trump voters (65) and third-party voters (60).
Early voting, just beginning in many states, is especially popular this year. Six percent of voters in the study have already voted compared to 2% at this time in 2016. Biden voters have been fastest out of the gate, casting more than two-thirds of the votes so far.
More than two-thirds of voters who have not yet cast their ballot say they plan to vote before election day, either by mail (30%), in person at an early voting location (19%), or by dropping off their ballot at an early voting location (17%). But concerns about the potential for problems with voting by mail have the potential to influence actual behavior.
Overall, about two-thirds of voters said that, compared to voting in person, voting by mail increases the risk of votes being lost or never counted.
Voter concern about fraud is particularly high among Trump supporters — 84% said that voting by mail will lead to fraud, compared to a third of Biden supporters. Similarly, more than 8 in 10 Trump voters said mail-in voting increases the chance votes will be lost. Just over half of Biden voters felt the same.
“A majority of voters agree that voting by mail increases voter safety during the pandemic and provides greater opportunities for everyone to vote,” said Jill Darling, survey director of the Daybreak Poll. “Yet concerns about mail voting and precinct fraud — instances of which are very rare, according to multiple studies — are now top-of-mind for some voters,particularly Trump supporters. That said, the majority of votes cast for Donald Trump so far have been by mail.”
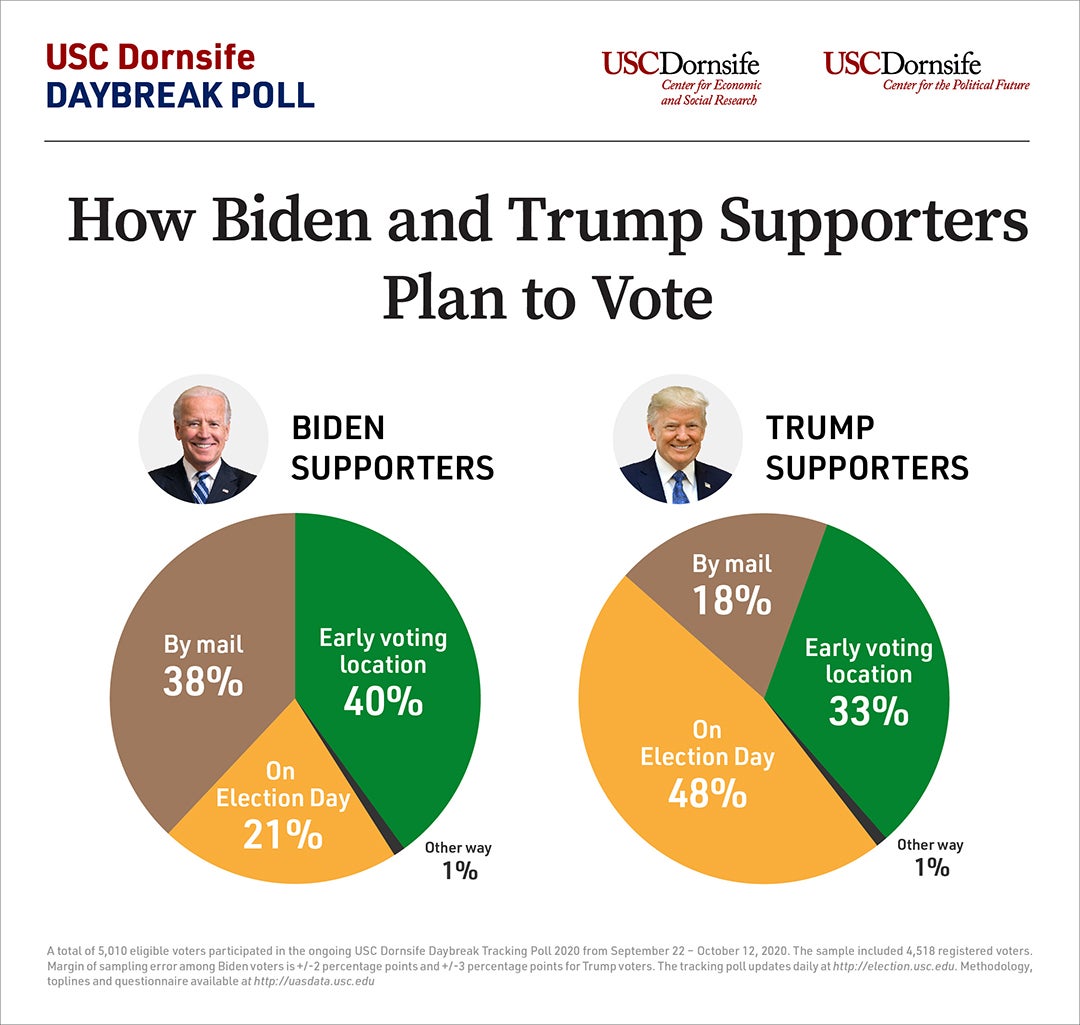
Biden voters are much more likely to say they will vote by mail (38%) or at an early voting location (40%). Only 21% plan to vote in person on election day. This is in stark contrast with Trump voters, only 18% of whom plan to vote by mail.
Nearly half of Trump’s supporters (48%) say they will vote in person on election day and one-third plan to vote early at a polling location. People in small towns and rural areas, where Trump is more likely to have supporters, are also more likely to wait until election day to vote. But the data analysis shows that the intent to vote on election day is significantly associated with being a Trump supporter, even more so than where voters live.
Voting methods by race and age
There are significant differences by race and age regarding the method by which people plan to cast their vote. About 43% of older voters (members of the Silent and Greatest Generations) plan to cast their vote by mail, compared to 29% of Baby Boomers, 26% of Generation X and 34% of millennials and Generation Z voters.
White voters are much more likely to vote in person on election day compared to voters of color. Black and Latino voters more often plan to vote early at a polling location than by mail or other methods.
- On election day, in person: white (38%), Black (27%), Latino (20%)
- Early, in person or dropping a ballot at a polling location: Black (45%), Latino (42%), white (33%)
- By mail: Latino (37%), Black (28%), white (28%)
About the poll
The national probability poll was conducted online from Sept. 22 to Oct. 12 by the USC Dornsife Center for Economic and Social Research (CESR) among 5,010 eligible voters who are members of CESR’s Understanding America Study panel. The poll has a margin of sampling error of +/- 1 percentage points for all voters and +/- 2 for registered voters.
The USC Dornsife Daybreak Poll 2020 is conducted by CESR in partnership with the USC Dornsife Center for the Political Future. It is funded in part by USC Dornsife with additional funding from research grants. The tracking poll is updated daily at election.usc.edu. Press releases, graphics, toplines and other documents are available from the Center for the Political Future and from CESR’s elections data page, which also provides access to data, and additional surveys and information.
Overall margin of sampling error for the sample of 4,518 registered voters is +/- 2 percentage points. Margin of sampling error for subgroups included in this analysis may vary, and are provided in the associated methodology and topline documents.

