October 2024
Drawing upon the just released 2023 American Community Survey (on September 12, 2024), Rock the Naturalized Vote 2024 is a project of ERI and the National Partnership for New Americans (NPNA) that seeks to demonstrate the potential impact and importance of recently naturalized immigrants in the 2024 election. It presents an interactive map and accompanying blog post highlighting our latest estimates of the size of the newly naturalized voting age citizen population—a group that may be motivated by and sensitive to the dynamics of immigration issues—and their composition by race/ethnicity and country/region of origin. It builds on earlier work, including our 2016 research brief and interactive maps. We hope the updated maps will be useful to activists, agencies, and civic and business leaders across the U.S. working on geographically focused civic engagement efforts with New Americans.
Read the blog post pointing out the importance of New Americans in key “swing” states and sharing testimonials from New American voters.
This sub-state/Public Use Microdata Area (PUMA) level map is also available at the state level.
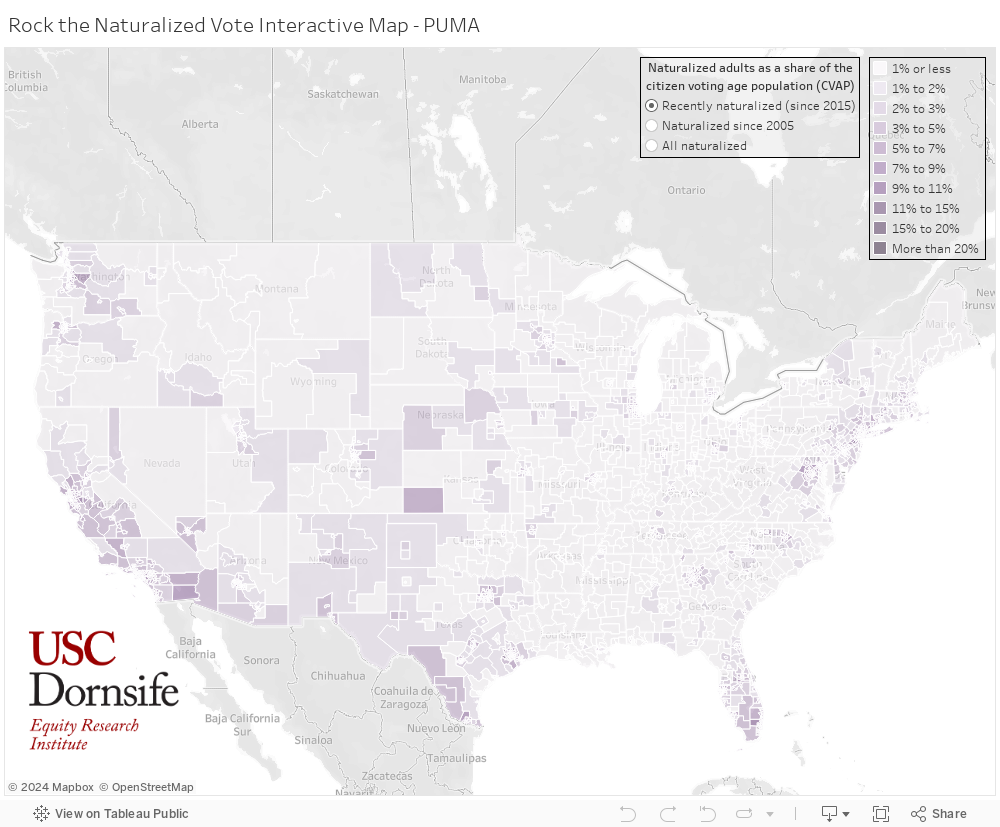
Tableau maps and underlying data developed by Sabrina Kim (Senior Data Analyst), Manuel Pastor (Director), and Justin Scoggins (Senior Data Manager).
How to Use the Map
Please note: this map is best viewed in Google Chrome.
There are three measures the can be mapped by clicking radio button near the map legend:
- “Recently naturalized (since 2015)” is the default setting and maps recently naturalized adults as a share of the CVAP—a group that is most likely to represent new voters and may be most sensitive to the dynamics of the immigration debate.
- “Naturalized since 2005” plots the somewhat recently naturalized adults as a share of the CVAP—a larger group of potential immigrant voters who also may be swayed by immigration issues.
- “All naturalized” plots all naturalized adults as a share of the CVAP—the broadest measure of the size of the potential immigrant vote.
Upon hovering over any state or sub-state area (Public Use Microdata Area, or PUMA), a table with detailed information on the size of the naturalized adult population by recency of naturalization (and their share of the CVAP) will appear. The table also reports (sample size permitting) the racial/ethnic and country/region of origin composition for just the recently naturalized adults in each geography—a group that is the focus of the map and the accompanying blog post. Please note that in reporting the racial/ethnic composition of the recently naturalized, “AANHPI” refers to the Asian American, Native Hawaiian, and Pacific Islander population.
-
To generate the data for the interactive maps, we applied the same methodology that is described in Appendix B of our 2016 report, Rock the Naturalized Vote II, to new data. Specifically, we drew upon the recently released 2023 American Community Survey (ACS) 1-year summary file from the US Census Bureau (released on September 12, 2024) along with a pooled sample of the 2020, 2021, and 2022 1-year ACS microdata from IPUMS USA (IPUMS USA, University of Minnesota, www.ipums.org).
The strategy was to use the 2023 1-year ACS summary file estimates to get the most up to date and accurate “topline” numbers of naturalized citizens by recency of naturalization along with the size of the citizen voting age population (CVAP), and to supplement that with the three most recently available ACS 1-year microdata files (2020, 2021, and 2022) to estimate the age, race/ethnicity, and country/region of origin distributions naturalized immigrants for the same time periods by recency of naturalization. We did this at both the sub-state Public Use Microdata Area (PUMA)—census-defined areas of at least 100,000 people—and state levels.
The reason for mixing data sources is that while the ACS summary file is released before the microdata and thus contains the most current estimates, it does not provide detailed demographic characteristics by recency of naturalization that can be tabulated using the individual-level responses to each question in the survey that are provided in the microdata. And since each year of the ACS microdata only provides a one-percent sample of the entire U.S. population, three years were pooled together (and survey weights adjusted, by dividing by three) to achieve a larger sample size, and thus more accurate estimates of the detailed demographic characteristics we report. In general, the more detailed the demographic characteristics one seeks to estimate, the more important it is to achieve a larger sample size. Thus, using the latest one-year summary file estimates for the topline numbers and the most recent three years of microdata for the detailed race/ethnicity and county/region of origin characteristics seemed to strike a reasonable a balance between currency and statistical reliability of the estimates.
One initial challenge we had to overcome, which was not faced in our previous analysis, was that we had to estimate which 2020 PUMA each respondent in the microdata resided in for the 2020 and 2021 years of the microdata sample. This is because the PUMA boundaries are redrawn following each decennial census and were not reflected in the ACS microdata until the 2022 survey year. We utilized a geographic crosswalk between 2010 and 2020 PUMAs from the Missouri Census Data Center that included the proportion of each 2010 PUMA’s population that fell in each 2020 PUMA it intersected (based on census block level population data from the 2020 Census). Individual respondents in the 2020 and 2021 years of the ACS microdata were randomly assigned to 2020 PUMAs in proportion to the population distribution found in the geographic crosswalk, with care taken to ensure that people living in the same household were assigned to the same 2020 PUMA.
The remainder of the procedure followed the same methodology that was implemented in our previous analysis, and those interested can find the details in Appendix B or our 2016 report, Rock the Naturalized Vote II. As for our previous interactive maps, because PUMA-level estimates by race/ethnicity or broad countries/regions of origin can emerge from a small sample size and have an uncomfortably wide margin of error, we suppress reporting such estimates in the PUMA-level maps for PUMAs with fewer than 1,000 recently naturalized citizens of voting age in 2023.
Acknowledgments
The USC Equity Research Institute (ERI) would like to thank the National Partnership for New Americans (NPNA) and the James Irvine Foundation for supporting this research effort. Specifically, we are grateful to Nicole Melaku and Nancy Flores of NPNA who were instrumental in making this data and analysis accessible to organizations and advocates working across the country to promote immigrant inclusion and civic engagement among recently-naturalized citizens. We also thank ERI staff who helped produce and publish the interactive maps and associated blog post, including Sabrina Kim, Thai Le, Manuel Pastor, and Justin Scoggins on the data and research side; Gladys Malibiran and Debora Gotta on the communications side, along with Santiago Rivera, Promise Pitman, and Joel Mendelson from New Heights Communications; and Rhonda Ortiz on the administrative side.
 The National Partnership for New Americans’ (NPNA) mission is to advance an immigrant equity and inclusion agenda at the state, local and federal level through policy, advocacy and service programs that create vast opportunities for immigrant and refugee communities to achieve full civic, social and economic justice.


