April 10, 2018
By Sarah Treuhaft with Jessica Pizarek, Ángel Ross, and Justin Scoggins
Please note: reports dated earlier than June 2020 were published under our previous names: the USC Program for Environmental and Regional Equity (PERE) or the USC Center for the Study of Immigrant Integration (CSII).
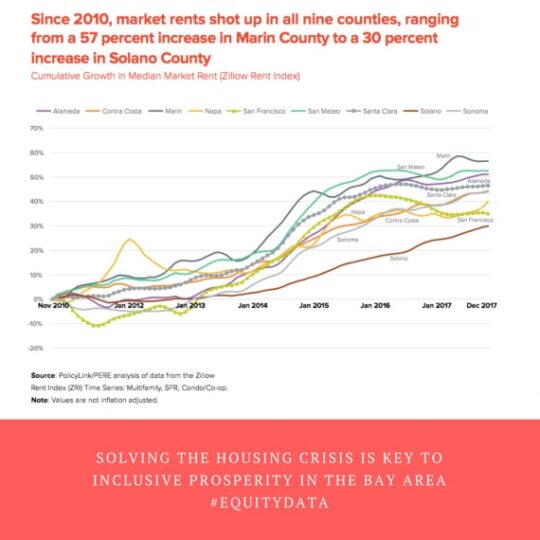
Solving the Housing Crisis Is Key to Inclusive Prosperity in the Bay Area presents new data and analyses that illustrate how rising rents and stagnant incomes are straining household budgets and stifling opportunity in the nine-county Bay Area, jeopardizing the region’s diversity, growth, and prosperity.
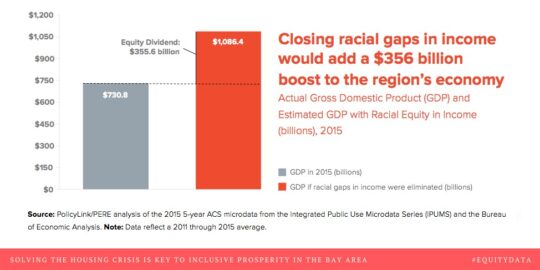
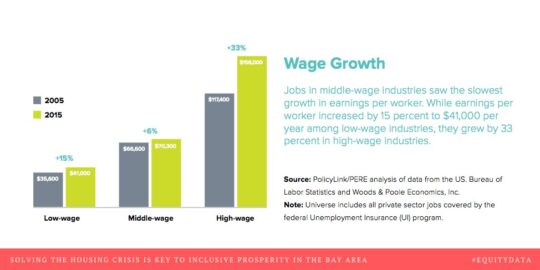
The twin forces of a housing shortage—particularly affordable housing—and uneven wage growth have created a regional crisis that hinders opportunity, growth, and prosperity for families and businesses alike.
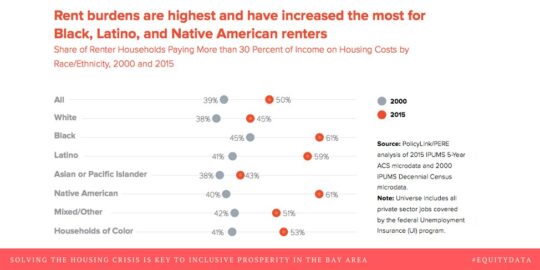
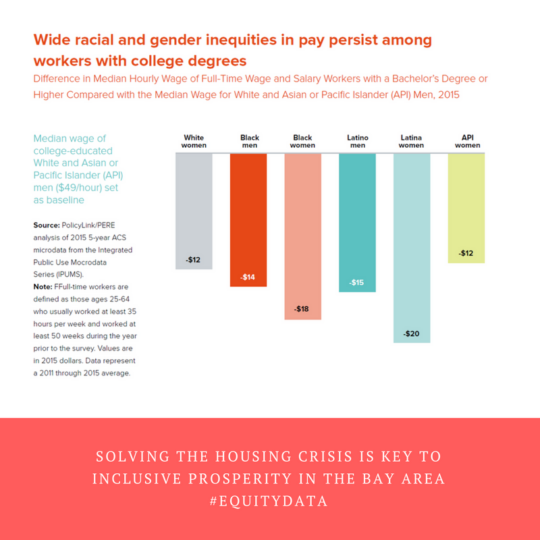
Though the housing crisis is far-reaching, it has hit low-income communities of color the hardest. Considering people of color are driving population growth in the region, these racial inequities pose a serious threat to the Bay Area’s future.
Solving the Housing Crisis Is Key to Inclusive Prosperity in the Bay Area was developed as part of the Bay Area Equity Atlas, a partnership between PolicyLink, The San Francisco Foundation, and the Program for Environmental and Regional Equity at the University of Southern California (PERE) that is working to create a regional platform designed to provide data and serve those who are seeking to advance solutions at a local and regional scale.
Read our other publications by research area