Rock the Naturalized Vote: How Data Can Improve the Political and Civic Inclusion of New Americans
As hopeful candidates and campaigns in this upcoming election focus their efforts to sway young voters, there is another voting demographic who also has the potential to turn the tides in a particularly close election: recently-naturalized citizens, or new Americans. During the 2020 election, about 1 in 10 eligible voters were naturalized citizens–more than 23 million. Since the 2020 election, there are an estimated 3.5 million newly-naturalized voting-age adults.
Similar to other election years, this notable growth in the recently-naturalized population is in part due to the large number of eligible-to-naturalize immigrants hoping to cast their votes at the ballot box. What is also driving the growth in naturalizations is the invested resources the Biden administration has put into addressing the backlog on citizenship applications that grew from the Trump administration and the COVID-19 pandemic. With these resources, we are also seeing the shortest processing times for citizenship applications in the recent decade.
Historically, naturalized citizen voter turnout rates in recent elections have generally trailed those of U.S.-born voters as engaging eligible naturalized citizen voters to show up to the polls has been a challenge. The climate around immigration, including anti-immigrant narratives and discriminatory policies designed to make it more difficult for minorities to vote, has deterred eligible immigrants from voting and pushed pro-immigrant advocacy groups to their capacity addressing crisis after crisis threatening the livelihood of immigrant communities.
This year’s election may be a different story. Naturalized citizens have the power to shape election results, especially in key swing states, and may be more motivated to show up to the polls this year than previous elections with increasing concerns about the economy and rhetoric around immigration. For those seeking to mobilize these voters to participate fully, tools that can help illustrate where newly naturalized voters live—and what share they might be of the electorate—can be useful.
The USC Equity Research Institute has long worked to develop data tools that can track the immigrant experience. Empowering and mobilizing all eligible voters, including naturalized citizens, to vote is essential in pursuing a democratic society and to hold elected officials accountable to their communities and constituents. Because of this, we have developed and updated a mapping tool to support organizations and advocates in their efforts to empower and mobilize recently-naturalized citizens.
Case Examples
As immigration continues to be a central policy issue in local and federal elections, there remains a significant drive in ensuring naturalized citizens have their voices heard. Particularly for the recently naturalized, representing a new voting bloc whose impact has been less analyzed, they make up a significant share of eligible voters (i.e., the citizen voting age population, or CVAP) who can dramatically change political landscapes. Such a phenomenon—in which naturalized voters who are sensitive to immigration issues and rhetoric make their voices heard at the ballot box and through on-the-ground advocacy—helped to change the political and policy landscape in California in the mid-1990s.
So what is the potential now? Altogether, naturalized citizens make up 10.1 percent of all potential voters in the United States. While all naturalized Americans merit outreach to ensure that they engage fully in our democracy, older naturalized citizens may already have set practices with regard to their civic participation. Of particular interest are recently naturalized voters who may need encouragement to embrace and build the habit of voting.
Turning to that group, using data that captures roughly a nine-year snapshot of naturalizations from 2015 through 2023, we find that recently-naturalized citizens comprise 2.8 percent—approximately 6.7 million potential voters—of the CVAP in the United States. Although the recently-naturalized population is growing across the country, focused strategies and efforts to improve registration numbers and to mobilize this voting bloc in key “swing” states can have consequential outcomes for their immigrant communities and families. Understanding who the recently naturalized are in these key states, such as their cultural and language background, can better inform strategies that are more appropriate and effective, resulting in greater impact and outcomes.
The Recently-Naturalized in Arizona
In Arizona, a battleground state in the 2020 election, Joe Biden narrowly defeated Donald Trump with just over 10,000 votes–approximately 0.3 percent of the 3.4 million votes in the state. In Arizona, there are nearly 465,000 naturalized eligible voters who make up approximately 8.6 percent of the CVAP. With close to 116,000, the recently naturalized (since 2015) comprise a quarter of all naturalized eligible voters in the state. This group of eligible naturalized voters are majority Latino (53 percent) and significantly from Mexico (46 percent).
Arizona
| Number | As % of CVAP | As % of all naturalized |
|
| Recently naturalized (since 2015) | 115,742 | 2.1% | 25% |
| Naturalized since 2005 | 246,709 | 4.6% | 53% |
| All naturalized | 464,549 | 8.6% | 100% |
Characteristics of the recently naturalized population in Arizona
| Race/ethnicity: | Number | Percent |
| White | 22,131 | 19% |
| Black | 7,597 | 7% |
| Latino | 61,763 | 53% |
| AANHPI | 22,216 | 19% |
| Mixed/other | 2,035 | 2% |
| Total | 115,742 | 100% |
| Country of origin (top ten): | Number | Percent |
| Mexico | 52,694 | 46% |
| Philippines | 6,178 | 5% |
| Iraq | 4,399 | 4% |
| India | 4,200 | 4% |
| Canada | 3,241 | 3% |
| Vietnam | 3,157 | 3% |
| China | 2,197 | 2% |
| England | 1,470 | 1% |
| Colombia | 1,318 | 1% |
| Nigeria | 1,185 | 1% |
| Other | 35,704 | 31% |
| Total | 115,742 | 100% |
Source: USC Equity Research Institute analysis of data from the U.S. Census Bureau and IPUMS USA. See our interactive map page for more detail. Note: All numbers are estimated and subject to error. Figures may not sum to totals due to rounding.
New American Testimonial: How Amritha Karthikeyan Shows Up for the Community
Photos and testimonials courtesy of the National Partnership for New Americans’ Naturalized and Ready to Vote Tour, 2024
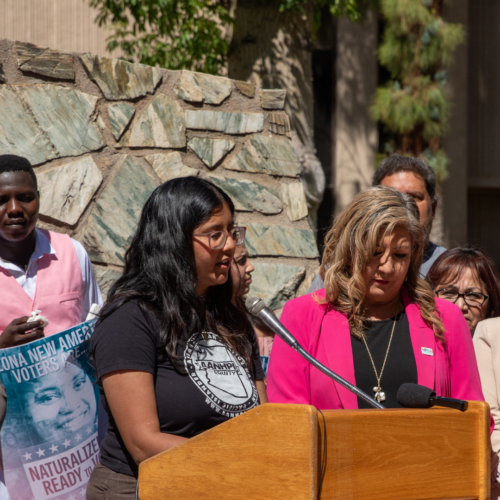
“When I was in high school I became more involved in youth organizing and community work that advocated for environmental justice especially for those in marginalized communities. With the 2020 election coming up during my senior year, my peers and I felt worried about the future as we were just about to graduate. At the time I couldn’t vote, so I was driven to help register my senior class to vote—ensuring that their voices too could be amplified through their ballots. I was eagerly waiting for the opportunity to become a citizen so that I could show up for my community in a different way. Two years later, the long-awaited moment arrived. My parents and I became U.S. citizens as soon as we were eligible to do so. This was not just a change in legal status for us. It marked a profound shift in how we could contribute to the country that I had grown to call home. Now, I can vote in elections, sign petitions, travel abroad more easily, be considered for more grants, scholarships and jobs, and even run for office. My family and I voted together for the first time in the 2022 midterms. To other newly naturalized voters I encourage you to use the power you have as a citizen of this country to make sure your voice is heard and elect someone to represent you and your community—but don’t stop there—show up for your communities in other ways, especially for those who cannot yet vote, join a community organization and contact your elected representatives.”
The Recently-Naturalized in Georgia
In Georgia, another battleground state in 2020, Joe Biden defeated Donald Trump with less than 12,000 votes–0.2 percent of the 4.9 million votes in the state. Similar narrow wins were seen by both Senators Ossoff (54,944) and Warnock (93,272) over their opponents. There are more than 600,000 naturalized eligible voters who make up approximately 7.6 percent of the CVAP. With over 187,000, the recently naturalized (since 2015) comprise nearly a third of all naturalized eligible voters in the state. The plurality of this group of recently-eligible voters are Asian American, Native Hawaiian, and Pacific Islander (AANHPI) (32 percent), followed by Black (25 percent) and Latino (25 percent). Among the recently naturalized in the state, one in ten are from India and another one in ten are from Mexico.
Georgia
| Number | As % of CVAP | As % of all naturalized | |
| Recently naturalized (since 2015) | 187,268 | 2.4% | 31% |
| Naturalized since 2005 | 362,641 | 4.6% | 60% |
| All naturalized | 602,792 | 7.6% | 100% |
Characteristics of the recently naturalized population in Georgia
| Race/ethnicity: | Number | Percent |
| White | 25,320 | 14% |
| Black | 47,552 | 25% |
| Latino | 47,072 | 25% |
| AANHPI | 59,121 | 32% |
| Mixed/other | 8,203 | 4% |
| Total | 187,268 | 100% |
| Country of origin (top ten): | Number | Percent |
| India | 18,818 | 10% |
| Mexico | 18,618 | 10% |
| Vietnam | 9,375 | 5% |
| Jamaica | 8,417 | 4% |
| Nigeria | 8,235 | 4% |
| Colombia | 6,424 | 3% |
| Ethiopia | 6,382 | 3% |
| China | 6,354 | 3% |
| Korea | 5,967 | 3% |
| Philippines | 4,189 | 2% |
| Other | 94,489 | 50% |
| Total | 187,268 | 100% |
Source: USC Equity Research Institute analysis of data from the U.S. Census Bureau and IPUMS USA. See our interactive map page for more detail. Note: All numbers are estimated and subject to error. Figures may not sum to totals due to rounding.
The Recently-Naturalized in Michigan
In Michigan, Joe Biden won by about 154,000 votes in 2020—under 3 percent of the 5.6 million votes in the state. With under 2 percent of the votes, Senator Peters defeated his opponent with similar margins (92,335). There are close to 400,000 naturalized eligible voters in Michigan who make up approximately 5.2 percent of the CVAP. With almost 120,000, the recently naturalized (since 2015) comprise nearly a third of all naturalized eligible voters in the state. Nearly half of this group identify as white (47 percent) and nearly a third are AANHPI (31 percent). The top country of origin among the recently naturalized in the state is Iraq (15 percent), followed by India (9 percent) and Mexico (8 percent).
Michigan
| Number | As % of CVAP | As % of all naturalized | |
| Recently naturalized (since 2015) | 119,237 | 1.6% | 30% |
| Naturalized since 2005 | 225,503 | 2.9% | 57% |
| All naturalized | 399,044 | 5.2% | 100% |
Characteristics of the recently naturalized population in Michigan
| Race/ethnicity: | Number | Percent |
| White | 56,410 | 47% |
| Black | 7,819 | 7% |
| Latino | 15,010 | 13% |
| AANHPI | 36,378 | 31% |
| Mixed/other | 3,620 | 3% |
| Total | 119,237 | 100% |
| Country of origin (top ten): | Number | Percent |
| Iraq | 17,677 | 15% |
| India | 10,717 | 9% |
| Mexico | 9,964 | 8% |
| Bangladesh | 6,692 | 6% |
| Yemen Arab Republic (North) | 5,508 | 5% |
| Canada | 5,167 | 4% |
| Lebanon | 4,502 | 4% |
| Philippines | 4,055 | 3% |
| China | 3,928 | 3% |
| Albania | 3,507 | 3% |
| Other | 47,522 | 40% |
| Total | 119,237 | 100% |
Source: USC Equity Research Institute analysis of data from the U.S. Census Bureau and IPUMS USA. See our interactive map page for more detail. Note: All numbers are estimated and subject to error. Figures may not sum to totals due to rounding.
The Recently-Naturalized in Nevada
In Nevada, Joe Biden won by about 33,596 votes in 2020—slightly more than 2 percent of the nearly 1.4 million votes in the state. There are more than 324,000 naturalized eligible voters in Nevada, which is nearly 15 percent of the CVAP. With almost 80,000, the recently naturalized (since 2015) comprise a quarter of all naturalized eligible voters in the state. Nearly half of this group are Latino (46 percent) and nearly a third are AANHPI (32 percent). The top country of origin among the recently naturalized in the state is Mexico (27 percent), followed by the Philippines (20 percent).
Nevada
| Number | As % of CVAP | As % of all naturalized | |
| Recently naturalized (since 2015) | 79,616 | 3.5% | 25% |
| Naturalized since 2005 | 165,005 | 7.4% | 51% |
| All naturalized | 324,237 | 14.5% | 100% |
Characteristics of the recently naturalized population in Nevada
| Race/ethnicity: | Number | Percent |
| White | 10,574 | 13% |
| Black | 4,620 | 6% |
| Latino | 36,634 | 46% |
| AANHPI | 25,782 | 32% |
| Mixed/other | 2,005 | 3% |
| Total | 79,616 | 100% |
| Country of origin (top ten): | Number | Percent |
| Mexico | 21,361 | 27% |
| Philippines | 15,832 | 20% |
| Cuba | 5,981 | 8% |
| El Salvador | 2,605 | 3% |
| China | 2,579 | 3% |
| Ethiopia | 2,179 | 3% |
| Vietnam | 1,983 | 2% |
| Guatemala | 1,563 | 2% |
| India | 1,485 | 2% |
| Canada | 1,385 | 2% |
| Other | 22,663 | 28% |
| Total | 79,616 | 100% |
Source: USC Equity Research Institute analysis of data from the U.S. Census Bureau and IPUMS USA. See our interactive map page for more detail. Note: All numbers are estimated and subject to error. Figures may not sum to totals due to rounding.
New American Testimonial: Edelweiss Solano’s Bigger Purpose
Photos and testimonials courtesy of the National Partnership for New Americans’ Naturalized and Ready to Vote Tour, 2024
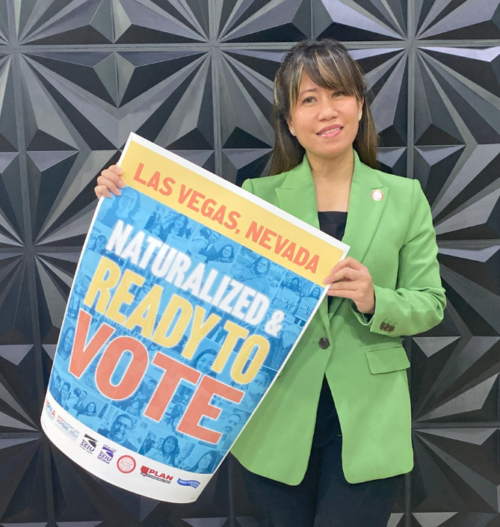
“I came to the US in 2013 in search of opportunities, where I can learn and experience a myriad of cultures through diverse perspectives. After receiving my legal permanent resident status, I had the privilege to work at an advocacy and social service organization, the Asian Community Development Council (ACDC) whose mission is to connect and empower the Asian American and Pacific Islander community in Nevada. ACDC makes U.S. Citizenship a reality for many, I am one of them. When I became eligible to naturalize last year, I applied without hesitation. On January 5th, 2024 I became a U.S. citizen. Being an American citizen is so much more than clutching that small American flag that I waved during my naturalization ceremony, it is about serving that bigger purpose. To have my voice finally be heard, to express my opinion on the candidate that I will vote for, one that reflects my values and represents the interest of my community to help build a democracy that represents, protects, and works for people like me, who look like me, who look like us. To my fellow naturalized citizens and New American voters, I encourage you to vote, and let your voice be heard.”
In our mapping tool, organizations and advocates can dig deeper and further examine the share of the recently-naturalized adult population and who they are at the Public Use Microdata Area (PUMA) level—geographic areas with a population of at least 100,000 utilized by the U.S. Census Bureau to tabulate data beneath the state level. An analysis at the PUMA level provides the ability for more focused strategies that account for more nuance and the local context, such as tailoring neighborhood-specific campaigns for recently-naturalized citizens from the same region of origin. Culturally-appropriate and language-inclusive messaging that leverages key issue areas impacting immigrants’ specific communities can have high-yield outcomes when mobilizing the recently-naturalized immigrant population.
Implications
Immigrants face systemic challenges in their civic and political inclusion. Research has shown multiplicative barriers to naturalization that prevent eligible immigrants from political and civic rights afforded to citizens, including voting and running for elected office. Even among naturalized citizens, they continue to be disenfranchised from the political process because of exclusionary systems that uphold social and political barriers to engagement, such as language and cultural barriers. In the current political climate, we are also seeing how naturalized citizens are further deterred from voting out of fears exacerbated by misinformation and discrimination.
Despite the heated rhetoric about immigration that occurs in every electoral season, naturalization has long been a point of bipartisan or nonpartisan agreement. In general, there is a shared sense that those who are in the country with authorization who have met the criteria to naturalize—at least five years of residence in the U.S., the ability to pass a U.S. civics test, and a willingness to swear an oath to the country—should live up to the responsibility of U.S. citizenship and participate in our electoral processes.
The data show that naturalized citizens are over a tenth of all citizens of voting age, and that the newly naturalized—those who became citizens since 2015—are nearly three percent of the electorate. This is a large share in elections that can be decided by thin margins—and the share of eligible voters who are newly naturalized varies significantly by state and sub-state areas (e.g., PUMAs).
In the interest of making data more accessible and promoting a representative democracy, our new tool at the PUMA and state level can inform strategies to effectively mobilize and catalyze a potential electorate force who continue to be marginalized and disenfranchised. We can turn to accurate data to protect the integrity of the democratic process and to counter threats from misinformation.
© 2024. This work is licensed under a CC BY-NC-ND 4.0 license.