Police Violence in Orange County, CA: Key Findings from URSUS and RIPA Data
Abstract
In the past years, police violence across the state and in Orange County have led to calls for systemic changes within the policing system. Several legislative actions have led to use of force reform and de-escalation technique implementation. Nevertheless, police use of force continues to be a persisting issue. While there are certain data limitations, this blog offers an analysis of RIPA and URSUS data in Orange County revealing that since 2020 uses of force actually increased; young males are more likely to be subject to use of force; and racial disparities persist among communities impacted by use of force incidents. In response, community members in Orange County have advocated to implement alternatives to police field responses. This blog offers three calls to action: (1) Support continued data collection and evaluation across data sets; (2) Evaluate and expand alternatives to armed police in traffic stops and other non-life threatening situations; and (3) Adopt a participatory budgeting process that invests in programs for youth and mental health.
Over the past decade, several instances of high-profile cases of excessive use-of-force¹, police killings, over policing of racial and ethnic minorities, and “aggressive involvement of local police unions in city politics” have resulted in calls for systemic changes within the Orange County policing system. These calls joined a chorus across the state demanding criminal justice reforms, leading to important legislative actions, including AB 392, a 2019 law modifying the state standard for when and how police can use deadly force and SB 230, implemented in 2021, mandating that agencies maintain policies that require officers to utilize de-escalation techniques and alternatives to force when feasible. In May 2020, the murder of George Floyd by a Minneapolis police officer and the national outcry against police violence prompted community members in Orange County to further explore potential solutions, including alternatives to police field responses for mental health crises and incidents involving those experiencing homelessness, as well as pursuing civilian oversight over police practices.
Legislative changes, oversight commissions, and the attention on police abuses pose the question: has there been a shift in uses of force in Orange County? This blog post aims to present key takeaways from an analysis of Racial and Identity Profiling Act (RIPA) and Use of Force (URSUS) data between the years of 2016 and 2022.
An Overview of The Racial and Identity Profiling Act and Use of Force Incident Reporting
RIPA DATA
In 2015, California passed AB 953 known as the Racial and Identity Profiling Act (RIPA) that requires Law Enforcement Agencies (LEAs) in the state to collect “perceived demographic data from specified police contacts.” RIPA was a result of the overdue need for recognition of accountability to communities of color at least in the form of data on law enforcement.
RIPA data must be collected during police encounters that involve “any detention,” as defined in the California Code of Regulations, “by a peace officer of a person; or any peace officer interaction with a person in which the officer conducts a search. RIPA data is based on the “perceptions of the deputy most involved in the stop,” and include perceived race/ethnicity, gender, sexuality, age, English proficiency, and disability of the person stopped. The data collection instructions outlined staggered implementation dates depending on the size of the agency. Pursuant to the implementation schedule, the Orange County Sheriff’s Department (OCSD), which includes jurisdiction in thirteen cities, began data collection on January 1, 2019; the Anaheim Police Department, Santa Ana Police Department University of California, Irvine (UCI) Police Department were the three additional Orange County agencies that reported data for 2021.
URSUS DATA
While RIPA data is extremely helpful in understanding the relationship between the reason for the stop, the perceived demographics of the person stopped, and whether the stop involved a use of force, the data does not account for the impact on the person of the use of force used. For this reason, it is also helpful to analyze the URSUS data to understand this impact. In 2015, AB 71 was passed, mandating that California law enforcement agencies (LEAs) report use of force incidents that result in serious bodily injury or death, or involve the discharge of a firearm. Starting in 2016, all agencies were required to collect data on use of force incidents to report to the California Department of Justice (DOJ).
The data captures incidents where “use of force by an officer or a civilian resulted in either serious bodily injury or death of an officer or a civilian, or the discharge of a firearm by either an officer or a civilian.” While URSUS offers us a look across a far greater number of agencies across a longer period of years, the data set is actually much smaller than the RIPA data due to the differing definition of use of force. Therefore, analyzing the two data sets together provides an accurate picture of any trends of use of force incidents in Orange County.
A Snapshot of RIPA and URSUS Data Over Time
The first question that was explored was whether use of force incidents have decreased in Orange County. According to URSUS data, there was a 44% decline in the total uses of force incidents between 2016 and 2020 (see Figure 1 below). However, uses of force actually increased by 33% between 2020 and 2022. So while we do see some decline over the multiyear period, the fact that use of force incidents have increased by 1/3 from pandemic-era levels, and in the two years following national outrage over George Floyd’s murder and uses of force in general, is alarming.
Figure 1. Use of Force Instances Over Time (URSUS), Orange County, 2016 – 2022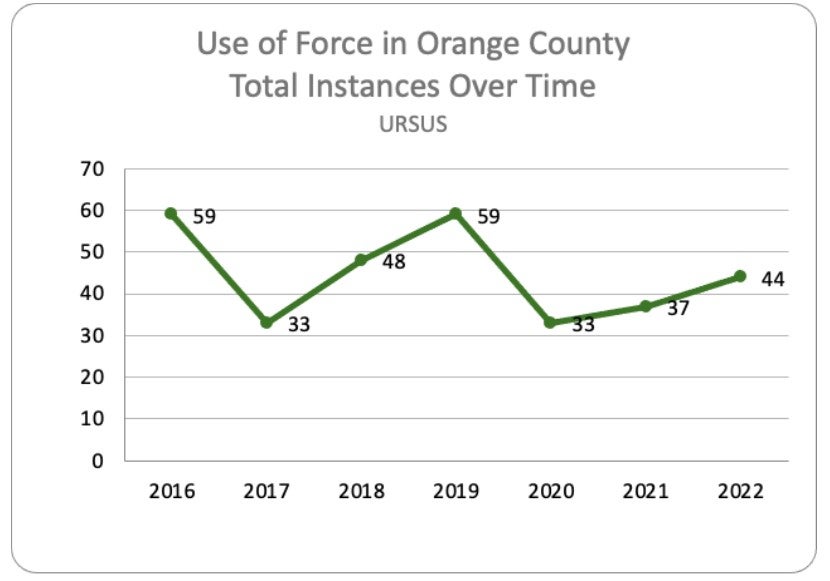 Source: USC ERI analysis of Use of Force Incident Reporting 2016-2022, California Department of Justice
Total reported RIPA use of force incidents for OCSD–the only department in Orange County for which, as of this writing, we have more than one year of data–showed a similar increase of nearly 34% from pandemic era levels (see Figure 2 below). However, there was an approximate 3% increase in the total use of force incidents between 2019 and 2021.
Figure 2. Use of Force Instances Over Time (RIPA), Orange County, 2019 – 2021
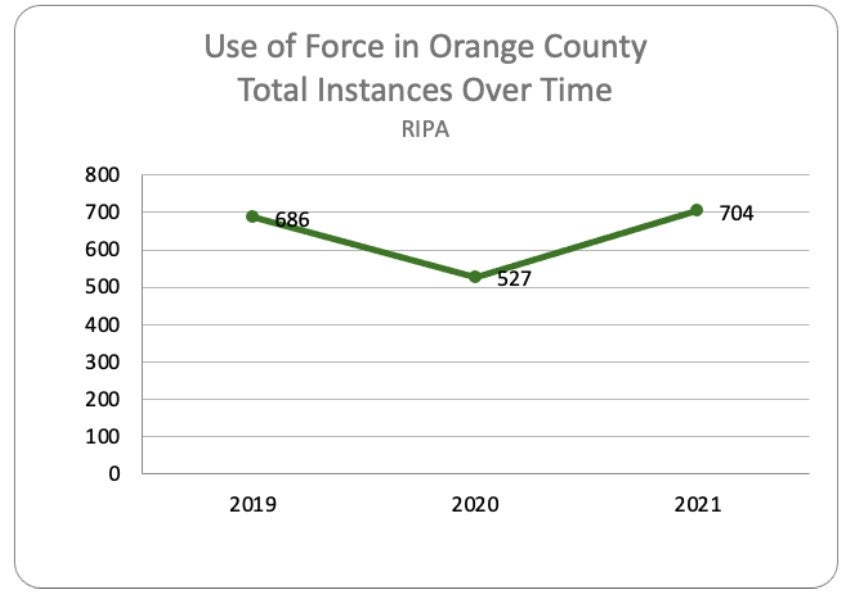
Source: USC ERI analysis of Racial and Identity Profiling Advisory Stop Data 2019-2021, California Department of Justice
It’s hard to say whether the increase in use of force incidents from pandemic-era levels will continue to rise, or surpass, pre-pandemic levels, or whether they will decrease, considering recent policy changes and the adoption of civilian responses to field crises. Telling is a 2021 analysis by the Orange County Office of Independent Review (OIR) that found that OCSD’s policies were not sufficient in providing adequate information on critical areas like “de-escalation and the use of lethal force”; OCSD’s training on “force and crisis intervention” showed concerning practices that could contribute to unacceptable conduct; and that the reporting and review practices of the OCSD made it a challenge to gather a comprehensive understanding of the OCSD’s ability to manage officer’s use of force. The OIR’s findings are consistent with the Policing Scorecard–a nationwide project that evaluates policing in cities across the United States—rating that the OCSD received, where it (and other Orange County police departments) scored poorly on police accountability and use of deadly force metrics.
Finding #1: Young males are more likely to be subject to use of force.
With overall incidents on the rise since 2020, it’s important to understand who is being the most impacted. According to URSUS data, males were disproportionately targeted, representing over 95% of those subjected to uses of force in Orange County. In comparison to the RIPA data, between 2019 and 2021, 83% of the incidents where the officer used a baton or other physical contact targeted males; while 17% of these incidents were toward women.
URSUS data, again, only includes use of force incidents that result in death, serious bodily injury, or involved the use of a firearm. For the years 2016-2022, 25% of use of force cases involved young people under the age of 26 (see Figure 3 below). Moreover, over 50% of cases in which the officer used a firearm involved youth and people 30 years and below. The RIPA data shows a similar trend, with young people under the age of 25 involved in 14% of stops in which an officer used force (see Figure 4). Furthermore, 56% of the stops involving the use of a baton or other physical contact involved youth and people 34 years old and under.
Figure 3. Use of Force Instances Over Time by Age Group (URSUS), Orange County, 2016-2022
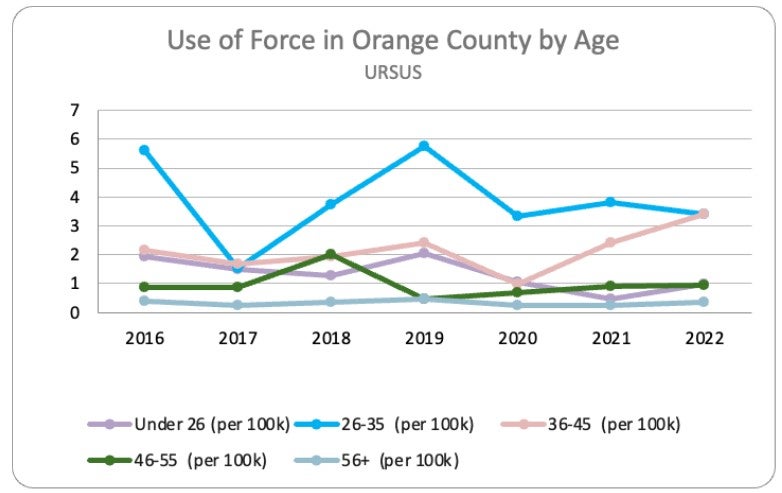
Source: USC ERI analysis of Use of Force Incident Reporting 2016-2022, California Department of Justice; American Community Survey 5-Year Estimates²
Figure 4. Use of Force Instances Over Time by Age Group (RIPA), Orange County, 2016-2022
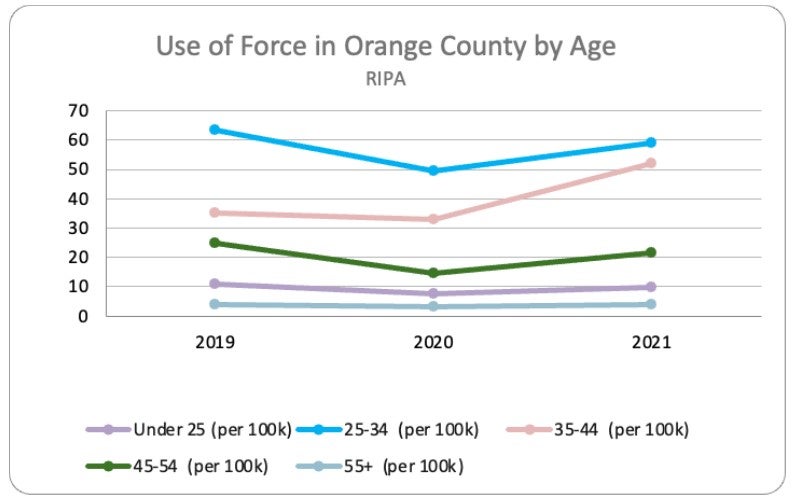
Source: USC ERI analysis of Racial and Identity Profiling Advisory Stop Data 2019-2021, California Department of Justice; American Community Survey 5-Year Estimates
Recent studies show that adolescence lasts up until the age of 24, with the adoption of adult roles and responsibilities much later, and that the human brain goes through a three decade long process of maturing and a slow transition to adulthood. This extended time of adolescence signifies that people may make impulsive, dangerous, or irrational decisions until they reach adulthood in their late twenties or thirties, but also means that those who experience traumatic life experiences during this developmental stage are at a particularly high risk of developing post-traumatic stress disorder.
Various county, municipal institutions, and non-profit organizations, remain steadfast to improve outcomes for youth through after school activities, improved health and nutrition, access to quality health care, and education. However, over fifty percent of the discretionary budget of the County goes to the “public protection” bucket, including the OC Sheriff/Coroner’s department, the courts, and the jails. Many cities’ budgets mimic this disproportionality. While health and wellness outcomes for youth across the County are improving, significant discrepancies exist for youth across race groups and socioeconomic status. That these disparities exist, that the budget to law enforcement and the carceral system continues to inflate, and that young men are the largest population group to suffer from uses of force in the County, begs the question whether government stakeholders are truly committed to improving the health and wellness outcomes for these youth.
Finding #2: Racial disparities persist among communities impacted by use of force incidents.
In both data sets, the racial/ethnic group most impacted by uses of force are Hispanics (see Figure 5 below)³. Of the uses of force involving a firearm in the URSUS data set, 60% of the victims were Hispanic, although the Hispanic community comprises about 36% of the total Orange County population. Black residents are also disproportionately impacted by the use of firearms by law enforcement, accounting for nearly 6% of the firearms uses of force, even though Black residents comprise only about 2% of the population. White and Asian individuals significantly represented less victims of firearms use than their respective proportions of the population. When adjusted for percentage of total population, Black individuals are the most overrepresented in uses of force. In fact, since the pandemic and George Floyd’s murder, the uses of force against Black residents in Orange County has seen the greatest increase.
Figure 5. Use of Force Instances Over Time by Race/Ethnicity (URSUS), Orange County, 2016-2022
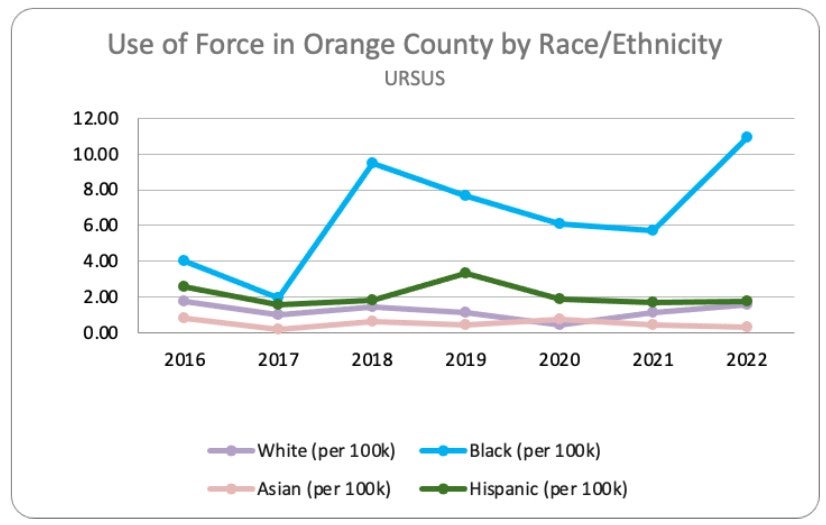
Source: USC ERI analysis of Use of Force Incident Reporting 2016-2022, California Department of Justice; American Community Survey 5-Year Estimates
Figure 6. Use of Force Instances Over Time by Race/Ethnicity (RIPA), Orange County, 2019-2021
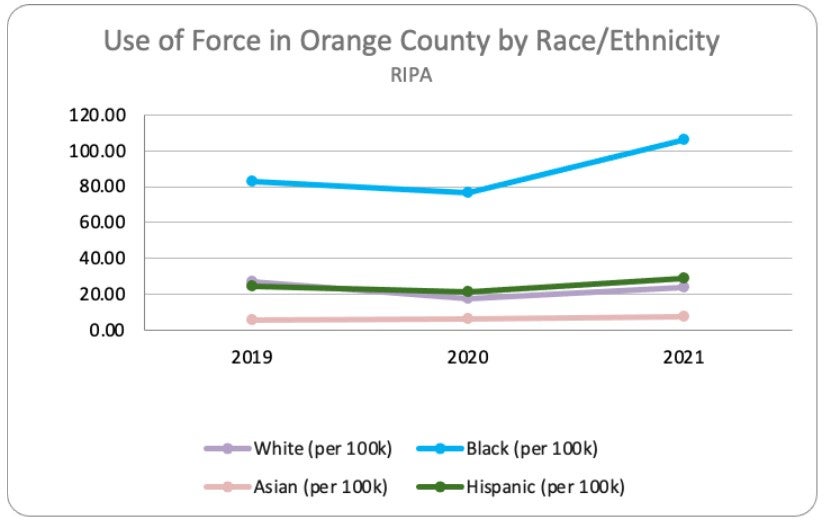
Source: USC ERI analysis of Racial and Identity Profiling Advisory Stop Data 2019-2021, California Department of Justice; American Community Survey 5-Year Estimates
Moreover, nearly 50% of uses of force in RIPA data result from traffic stops, as opposed to other underlying reasons for the police encounter such as reasonable suspicion, parole/probation stops, and consensual encounters. Of those traffic stops, 69% of stops involved Hispanic individuals and 4% involved Black individuals, again representing a significant disproportionality relative to the population size of these groups. When looking at the reason for stop breakdown within each racial category, about 54% of the stops involving Hispanic individuals involved traffic stops, as compared to the proportional breakdown for the White population which shows about 37% for traffic stops and 37% for reasonable suspicion.
That so many uses of force result from traffic stops is concerning for a few reasons. First, an officer may stop a vehicle if the officer believes the driver to have committed any number of traffic infractions, such as not signaling when changing lanes, or not having their front license plate attached to their vehicle. Once a person is pulled over, they are required under the law to give their identification to the officer; whereas during a pedestrian stop, a person is not required to identify themselves to an officer under California law. Traffic stops are ripe for abuse and racial biases and are likely to be pretextual in nature. For this reason, some California communities have been advocating for an end to police involvement in traffic enforcement.
Call to action
Data is a critical tool to understanding trends, but it also has its limitations. While we are able to understand the impact based on race and age categories, we have been unable to identify a useful “finding” regarding the uses of force involving those with perceived mental health disabilities. Officers are not significantly perceiving people with mental health disabilities in the field, perhaps due to the fact that officers are not trained mental health professionals. Noteworthy is that since its launch in October of 2023, Orange County’s CARE Court, which at this point only accepts those with schizophrenia or other psychiatric disorders, has received 34 referrals to the program. This may be an indication that people with mental health disorders are entering the criminal justice system, but are not being identified as having mental health disorders during field encounters.
Community members in Orange County have made their desire increasingly clear that youth and those with underlying mental health issues should not be funneled into the criminal system and on the receiving end of a baton or bullet to resolve issues that stem from poverty, inequitable health access, or family violence. And while our long-term vision is to not have police rely on use of force tactics when they interact with the public, community as a whole needs to seriously evaluate the circumstances under which armed officers should interact with civilians in the first place, particularly when the most vulnerable populations–and populations most impacted by societal inequities–are subjected to disproportionate uses of police force.
I therefore offer three specific calls to action that we can lean into as social justice warriors in our communities:
1. Support continued data collection and evaluation across data sets.
We need to continue to understand use of force incidents, understand the RIPA data once reporting for all of Orange County law enforcement agencies is publicly available, and assess whether use of force incidents continue to rise from pandemic-era levels. We also need to compare this data with newly available prosecutorial data, and it would be helpful to not just track officer perception of race and other identifying characteristics, but to track actual race and identifying characteristics.
2. Evaluate and expand alternatives to armed police in traffic stops and other non-life threatening situations
Much of community organizing across the state has focused on ending pretextual stops, police involvement in traffic stops, and police involvement in mental health crises and with those experiencing homelessness. Orange County, as its numbers are demonstrated in this blog piece, should be no exception to this movement. Our communities and elected officials need to both expand and rigorously evaluate the effectiveness of the different models that exist such as the Crisis Assessment Team, Be Well responder vans, and the North County Hope Center, and continue to develop 911 diversion and direct community call-in models.
3. Adopt a participatory budgeting process that invests in programs for youth and mental health.
Calls from the community for a transparent and participatory budgeting process in Orange County have been steadily rising since the pandemic. Adopting a participatory budget that invests in youth, mental health, education and overall wellness would divert youth and those experiencing homelessness or mental health crises away from the criminal justice system and alleviate the determinants of crime, family violence, and substance abuse in our communities.
Contributors
Thank you for your support and assistance from the USC Equity Research Institute team Clara Alvarez Caraveo, Research Assistant; Dr. Sean Angst, Postdoctoral Scholar; Dalia Gonzalez, Data Analyst II; Gladys Malibiran, Communications Manager; Dr. Kim Tabari, Organizational Development Director; and Dr. Jody Agius Vallejo, Associate Director.
________________________________
¹ Types of Use of force, according to the URSUS data are Animal, Blunt / impact weapon, Carotid restraint control hold, Chemical spray (e.g. OC/CS), Civilian physical contact, Civilian vehicle contact, Discharge of firearm (hit), Discharge of firearm (miss), Electronic control device, Impact projectile, K-9 contact, Knife, blade, or stabbing instrument, Officer vehicle contact, Other control hold/takedown, Other dangerous weapon, Other physical contact (Use of hands, fists, feet, etc), or Threat of firearm.
² Estimates for the age categories using the American Community Survey do not align exactly with the age categories reported in the URSUS data. The American Community Survey used the age categories of Under 25, 25 to 34, 35 to 44, 45 to 54, and 55 years or more. To make the results comparable, we interpolated the ACS age groups to align with the URSUS boundaries by assuming an equal number of individuals for each year.
³ Though “Hispanic” may not be the word of choice for members of the Latinx/Chicanx community, we use it here as officers were asked about perceived “Hispanic” race/ethnicity in the data set.
 About the author:
Ameena Mirza Qazi, ERI Scholar-Activist in Residence 2023
Ameena is a social justice attorney, policy analyst, and activist from the Peace and Justice Law Center in Fullerton, California.