New ERI data map: Exploring “the Four Quadrants of American Politics”
The project was a collaboration between the University of Southern California Equity Research Institute and The Atlantic.
Published on May 9, 2023
In early 2023 the University of Southern California Equity Research Institute (USC ERI) partnered with Ron Brownstein of The Atlantic to analyze demographic data from the US Census Bureau’s 2020 5-year American Community Survey, along with election outcomes by congressional district from the 2022 mid-term elections (118th Congress), provided by Daily Koss Elections.
The analysis, featured in a recent article in The Atlantic (as well as a follow-up article), organizes the 435 US congressional districts into four quadrants defined by (1) whether they are above or below the national average percentage people of color (POC), defined as all people not identifying as non-Hispanic white, and (2) whether they are above or below the national average percentage of non-Hispanic white adults (age 25 or older) that have a bachelor’s degree or higher. Education levels among non-Hispanic white adults, rather than all adults, were used because they are associated with a more distinct difference in political behavior than for people of color.
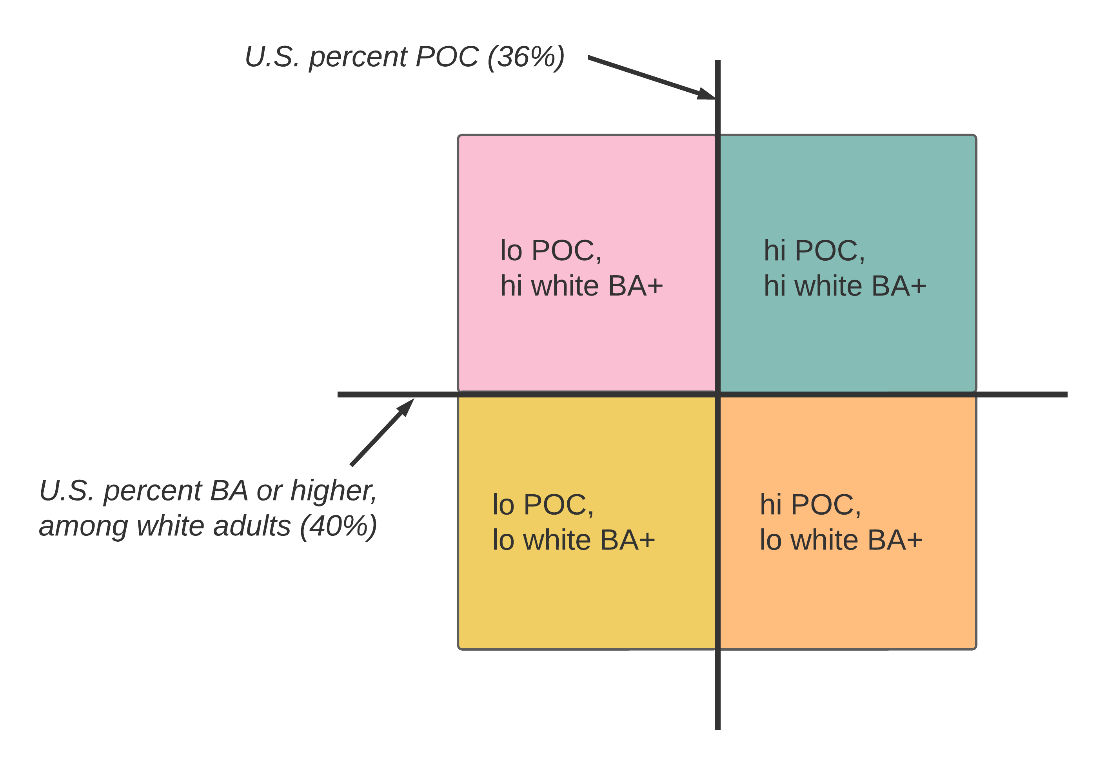
To understand better how we did the breaks and how the Congressional Districts are allocated between the parties, we offer more background below. Starting with Figure 1, we show the two dividing lines that form the quadrants—the percentage people of color for the nation overall (36 percent) and the percentage of all non-Hispanic white adults in the nation that have a bachelor’s degree or higher (40 percent).
Figure 1: Understanding the quadrants
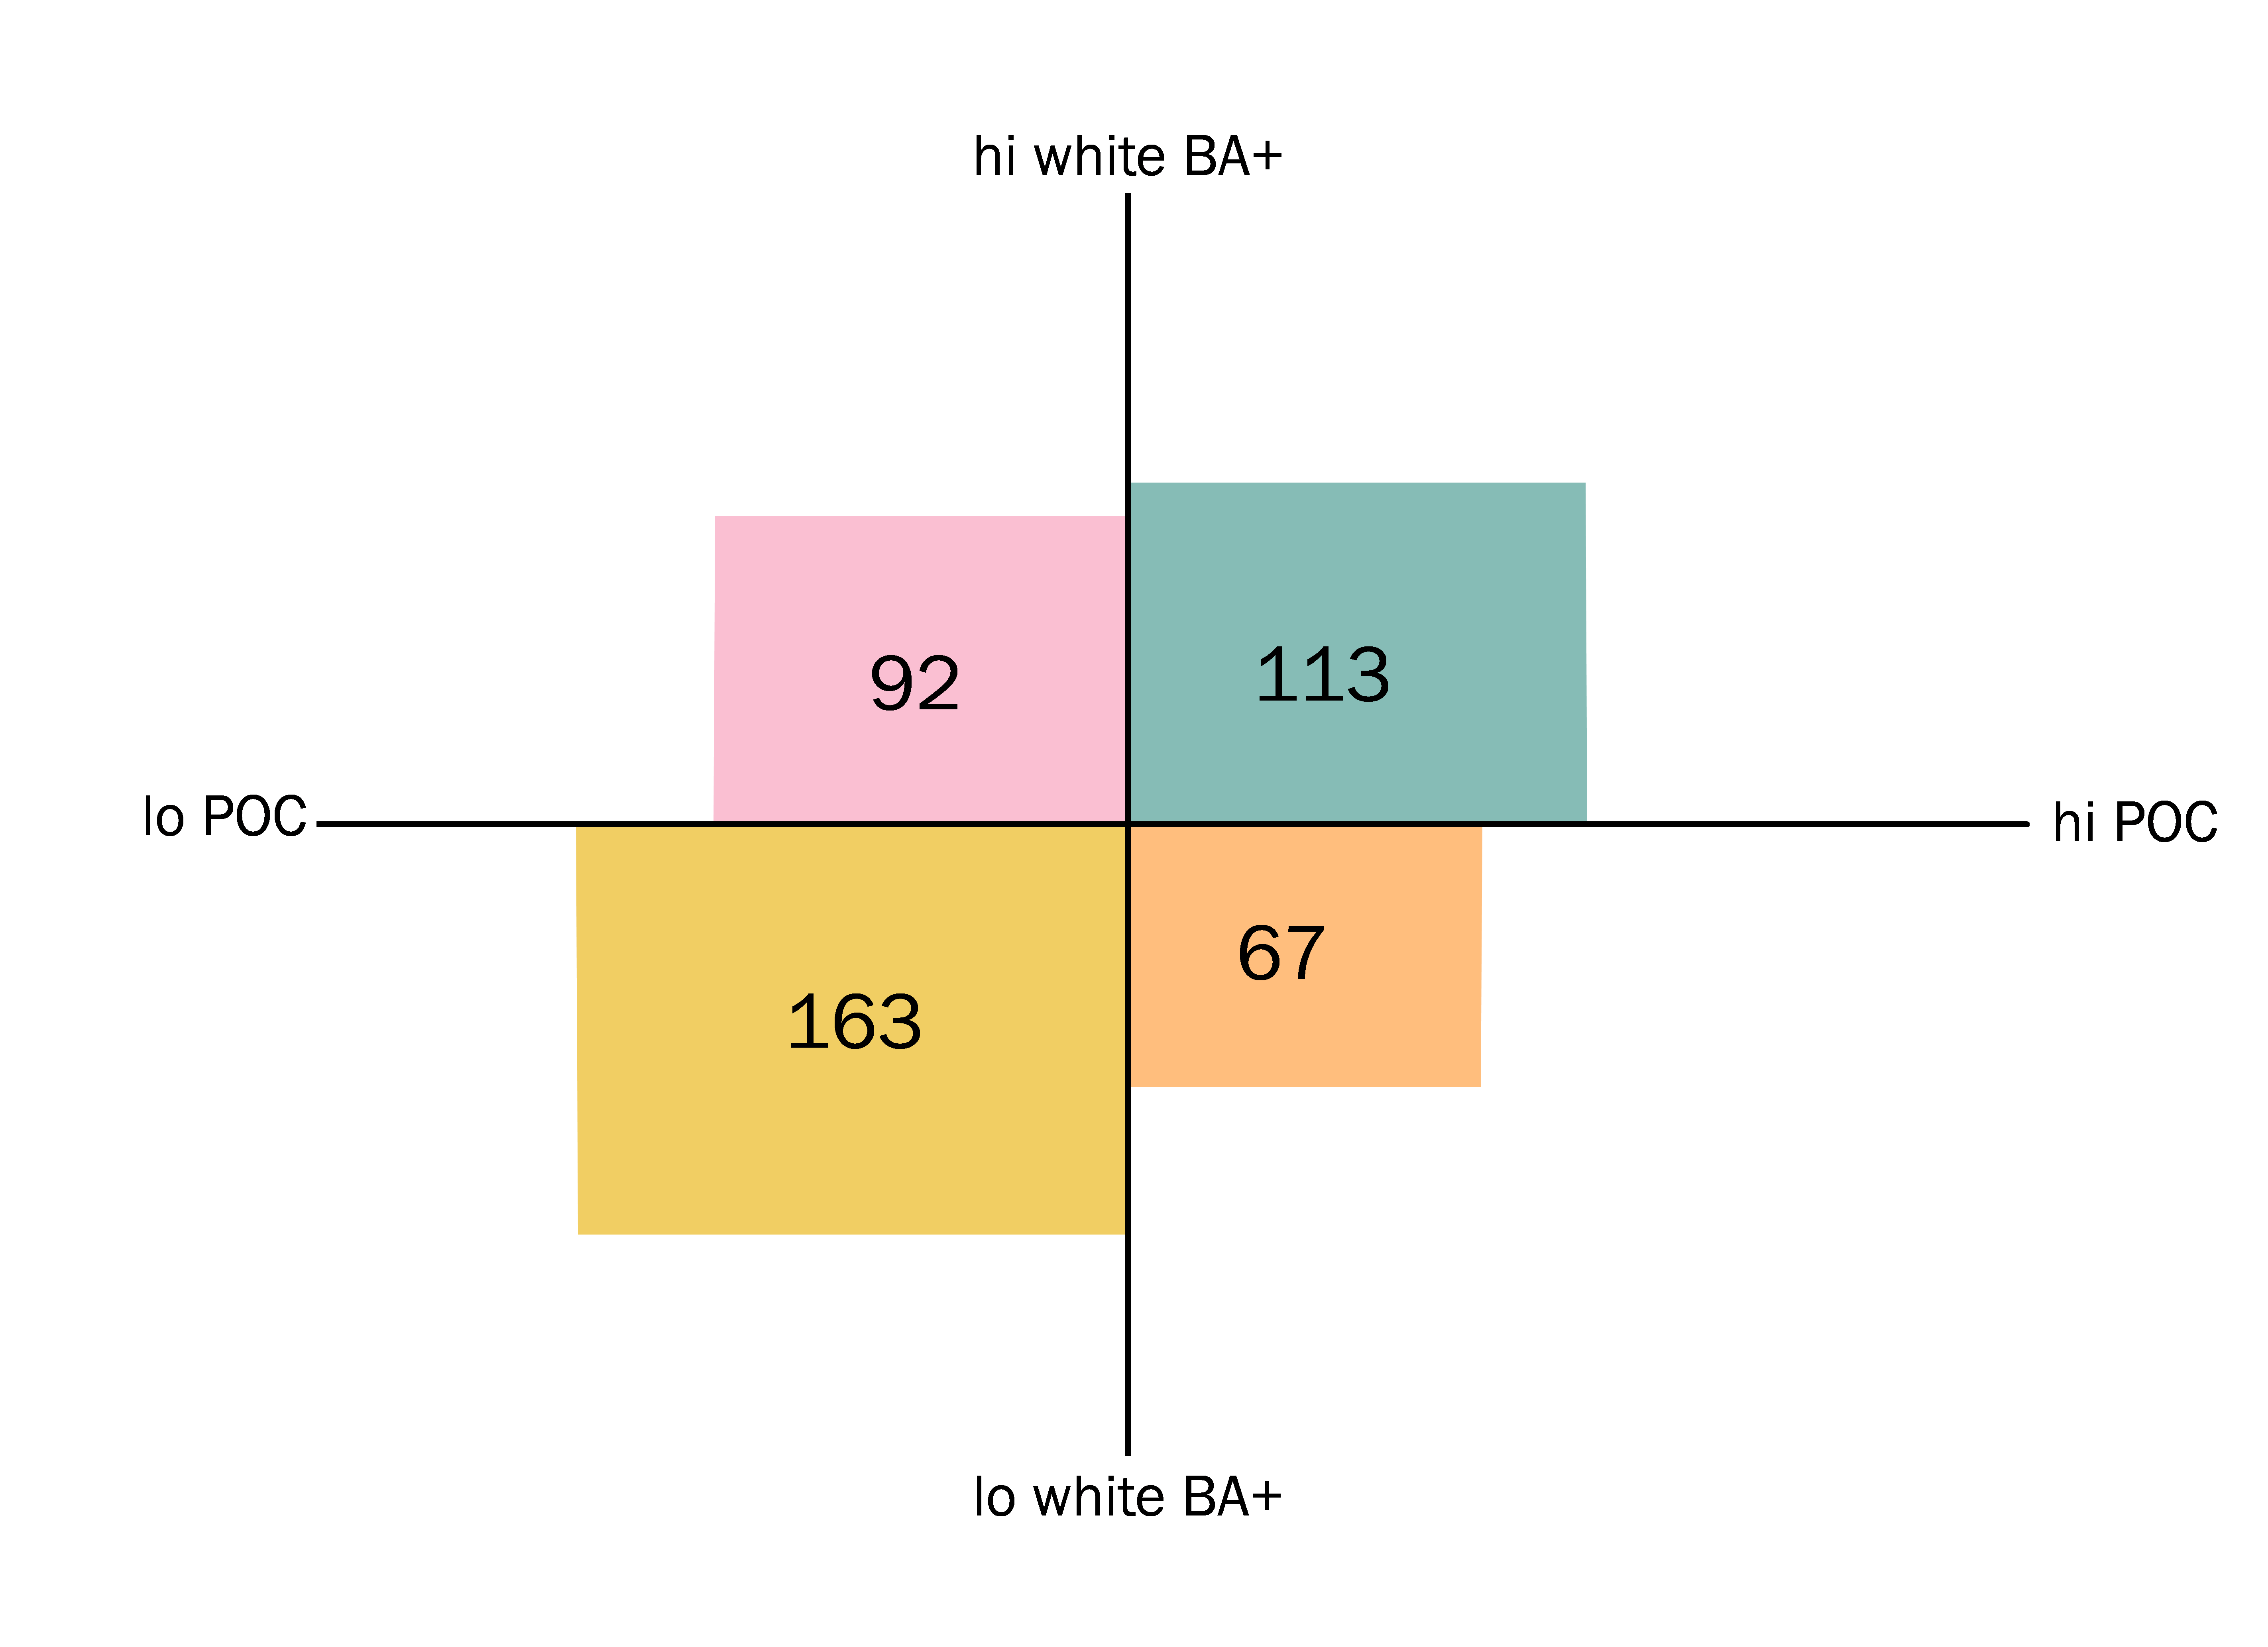
Among all 435 districts in the nation, 163 (or 37 percent) are in the “lo-lo” category with both a lower percentage people of color than the nation overall and a lower share of white adults with a BA or higher; 113 (or 26 percent) are in the “hi-hi” category; 92 (or 21 percent) are in the “lo-hi” category; and 67 (or 15 percent) are in the “hi-lo” category. (Note that the aforementioned percentages do not add up to 100 due to rounding.) Thus, as shown in Figure 2, there are far more districts that are at either end of the spectrum – relatively more diverse with a highly educated white population, or less diverse with a less educated white population – than there are in between (i.e., relatively more diverse with a less educated white population or vice versa).
Figure 2: Number of congressional districts by quadrant, all districts (118th Congress)
Source: USC Equity Research Institute analysis of data from the 2020 5-year American Community Survey summary file and Daily Kos Elections furnished by Ron Brownstein.
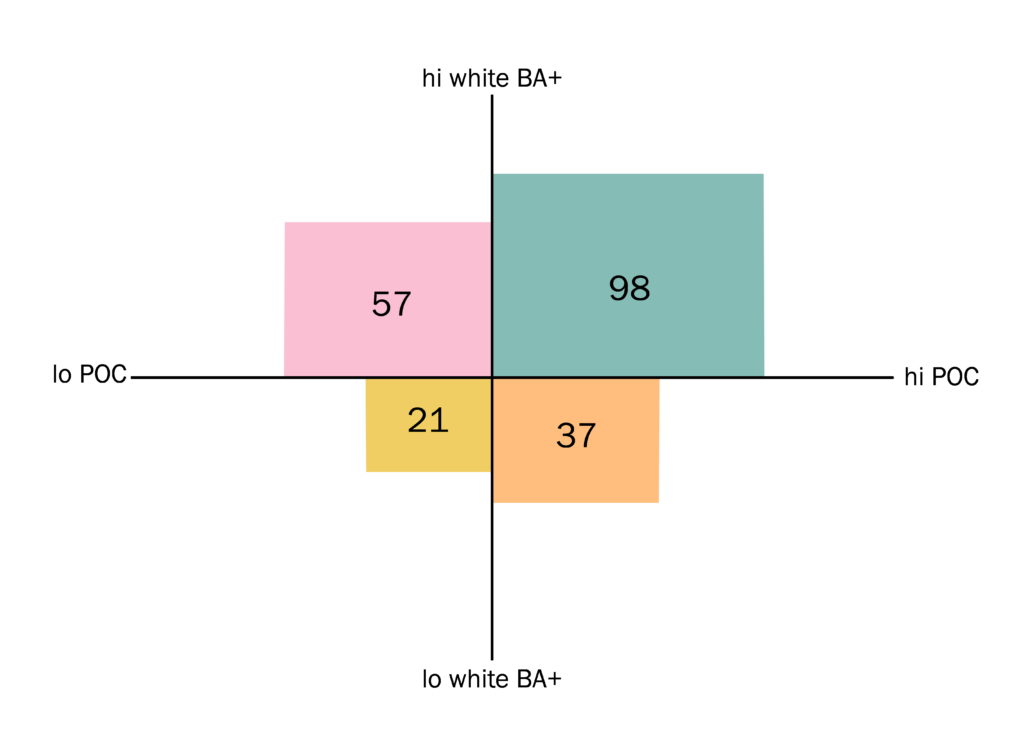
By looking at the political party representing each district, we see that the two ends of this demographic spectrum also form the bases of the Democratic and Republican parties, respectively. Among the 213 districts controlled by Democrats, nearly half (98) are in the “hi-hi” quadrant (Figure 3), whereas, among the 222 Republican districts, nearly two-thirds (142) are in the “lo-lo” quadrant (Figure 4).
Figure 3: Number of congressional districts by quadrant, Democratic districts (118th Congress)
Source: USC Equity Research Institute analysis of data from the 2020 5-year American Community Survey summary file and Daily Kos Elections furnished by Ron Brownstein.
Figure 4: Number of congressional districts by quadrant, Republican districts (118th Congress)
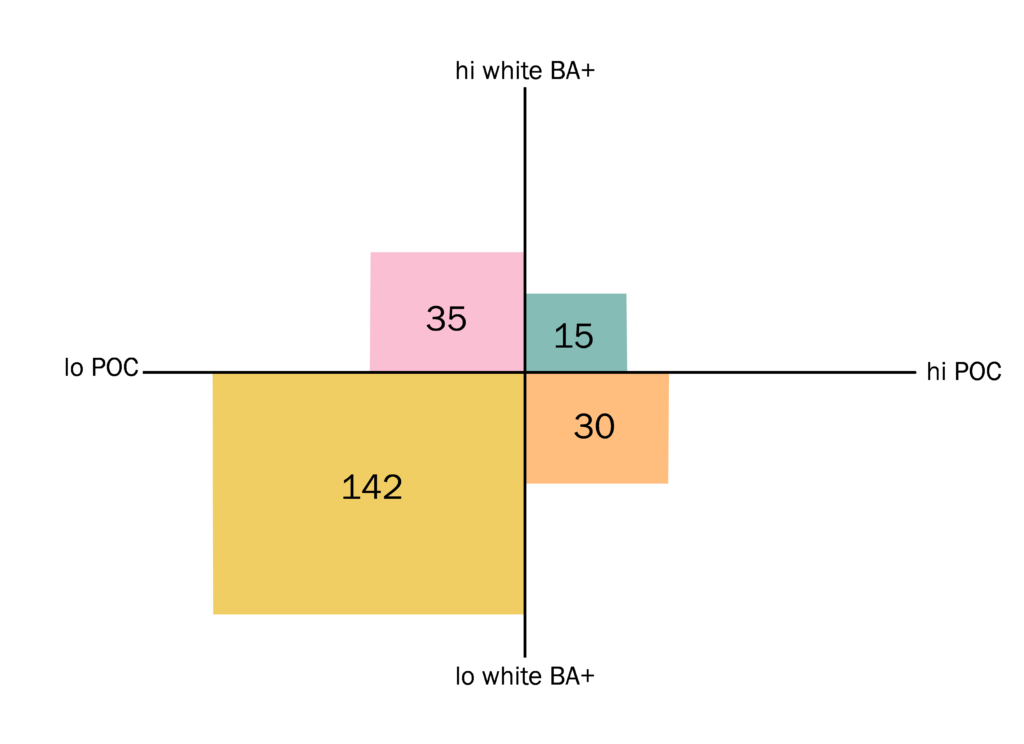
Source: USC Equity Research Institute analysis of data from the 2020 5-year American Community Survey summary file and Daily Kos Elections furnished by Ron Brownstein.
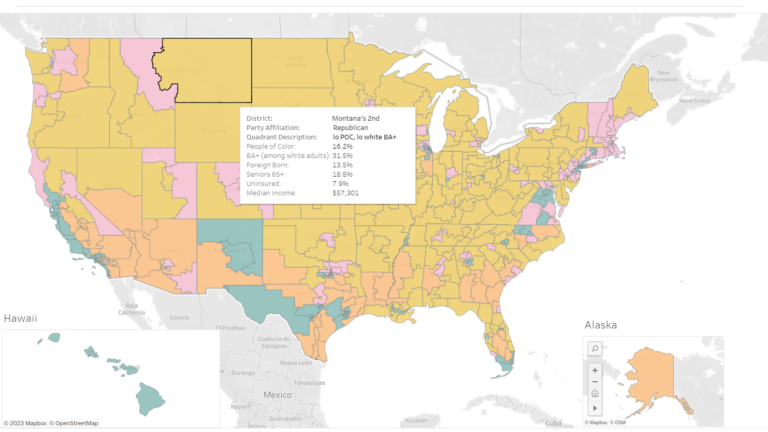
Explore the map below to understand the powerful connection between these two simple demographic measures and political partisanship across US congressional districts, and read Ron Brownstein’s take on the data here. In a follow-up article, Ron also analyzed the relationship between seniors, income, and health insurance. Those variables (along with the percent foreign-born) are available by hovering over each district on the map to get a richer view of the demographic composition.
- Data analysis by Jeffer Giang and Justin Scoggins
- Map by Sean Angst