
Heat risk isn’t just about the highs: Large daily temperature swings can harm human health – maps show who is affected most
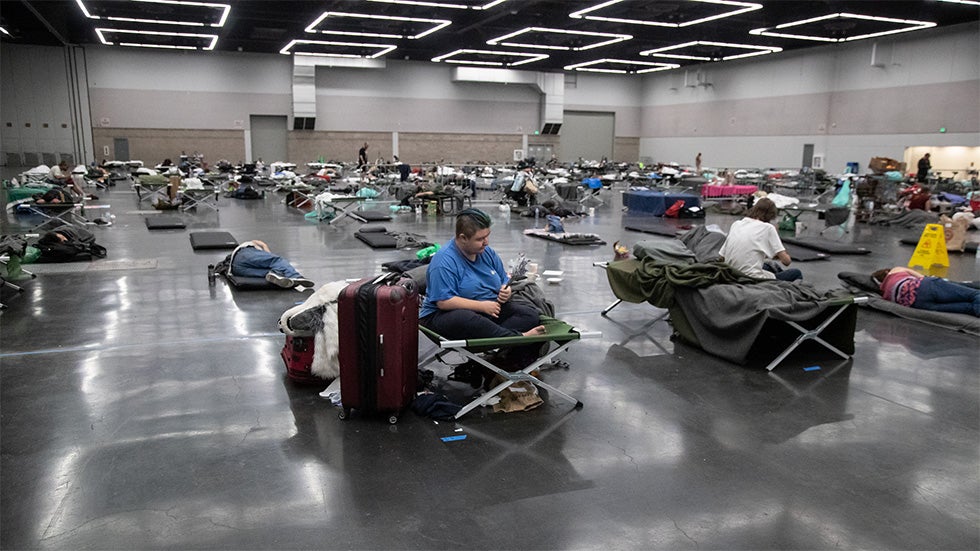
This summer has shown how quickly high temperatures can pose serious health risks, with record-breaking heat waves claiming thousands of lives around the world.
However, it’s not just high and low temperatures that matter. How many degrees the temperature swings within a day — the daily temperature variation — itself poses health risks.
Studies have found that days with larger than normal temperature swings can increase asthma flare-ups and hospitalizations for respiratory and cardiovascular diseases, leading to an overall higher death rate than normal. One study, based on data from 308 cities from 1972 to 2013, estimates that 2.5% of deaths in that time could be attributed to large daily temperature swings.
Although humans can live in a wide range of ambient temperatures, a dramatic shift in temperature can tax multiple systems in the body, including the immune, musculoskeletal and cardiovascular systems. It can be especially taxing on very young and older individuals, who are generally more vulnerable to harsh climates.
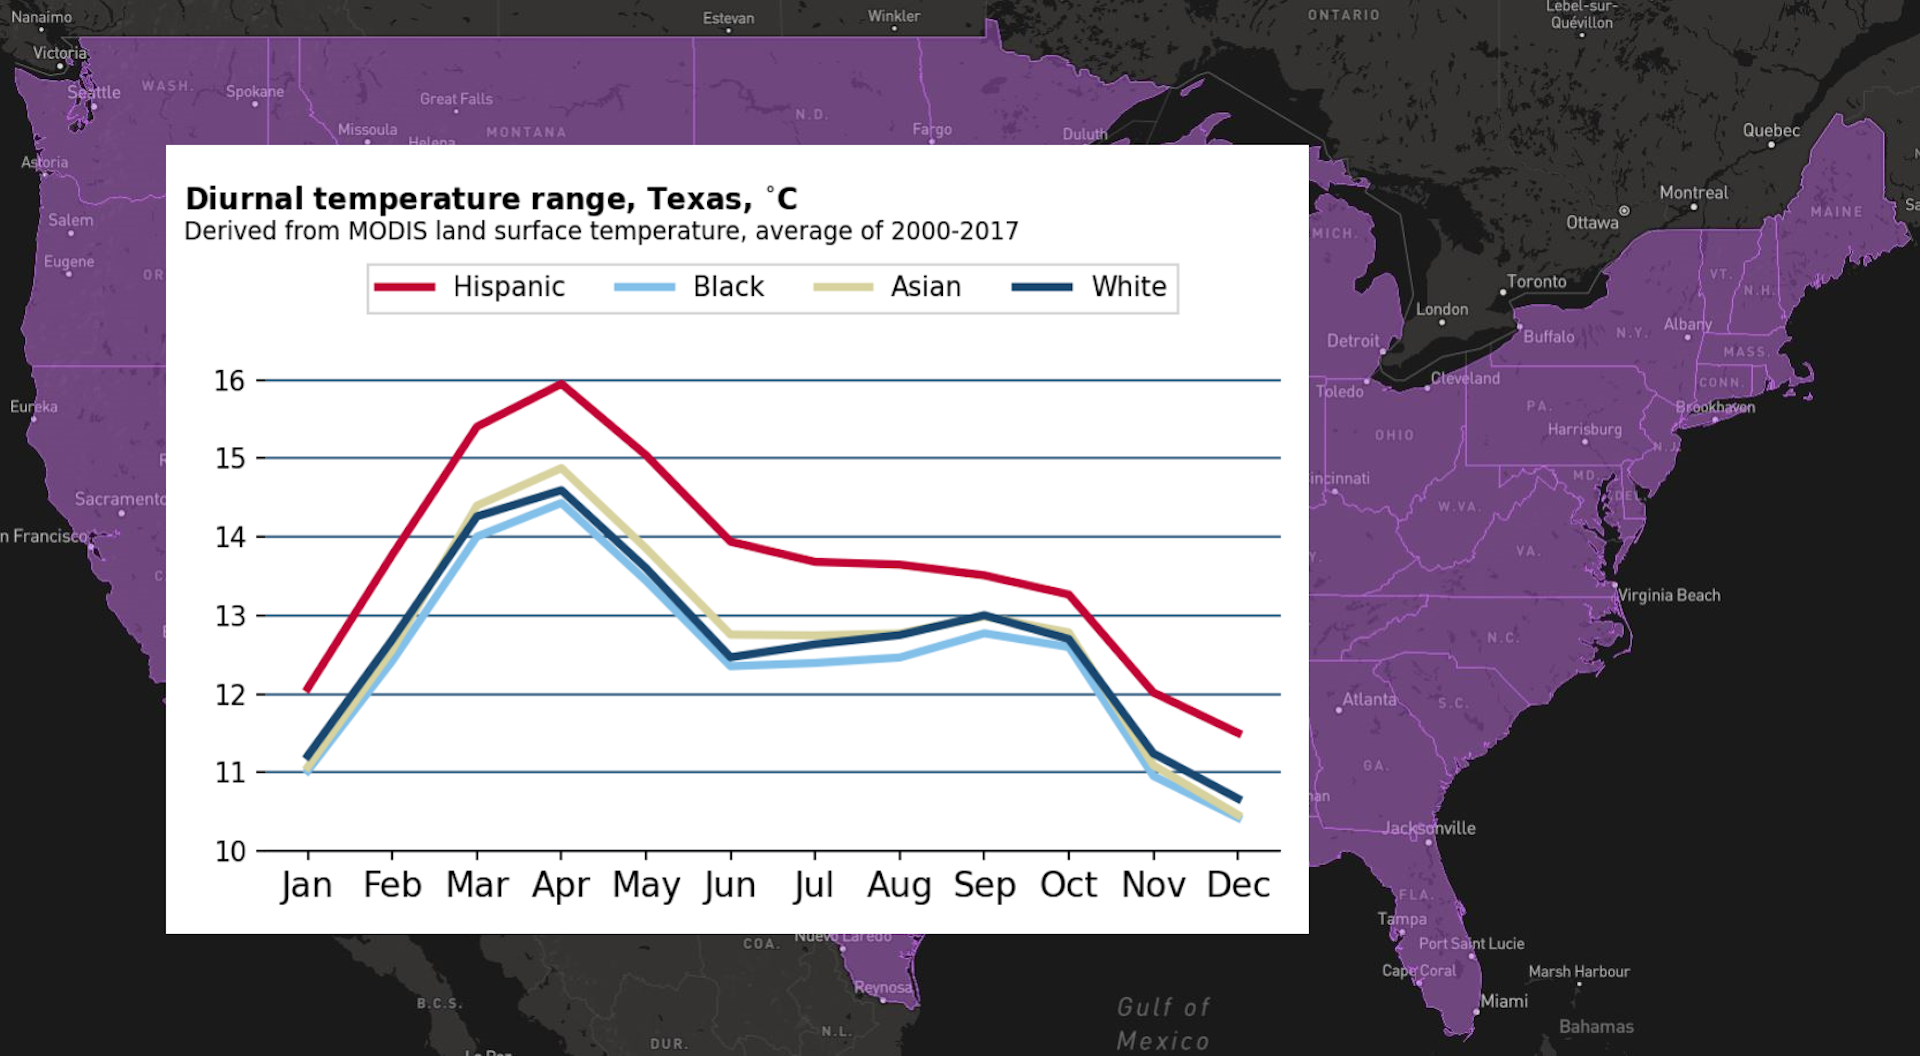
We mapped daily temperature variations at the neighborhood scale across the U.S. to get a better picture of where these temperature swings are highest and who is most affected. The results highlight how poverty and a legacy of discriminatory practices have left racial minorities and low-income residents in neighborhoods with more dramatic temperature differences through the day.
What affects temperature swings?
Large night-to-day temperature swings are more common in some regions, such as the U.S. Southwest, but they can also vary over short distances depending on the landscape and what’s known as the urban heat island effect.
For example, the ocean can mitigate rapid temperature changes since water can absorb a lot of heat before it gets hot. The Greater Los Angeles area is a case in point. Santa Monica, a coastal community in Los Angeles County, has much smaller temperature swings then more inland neighborhoods in the county, like downtown Los Angeles.
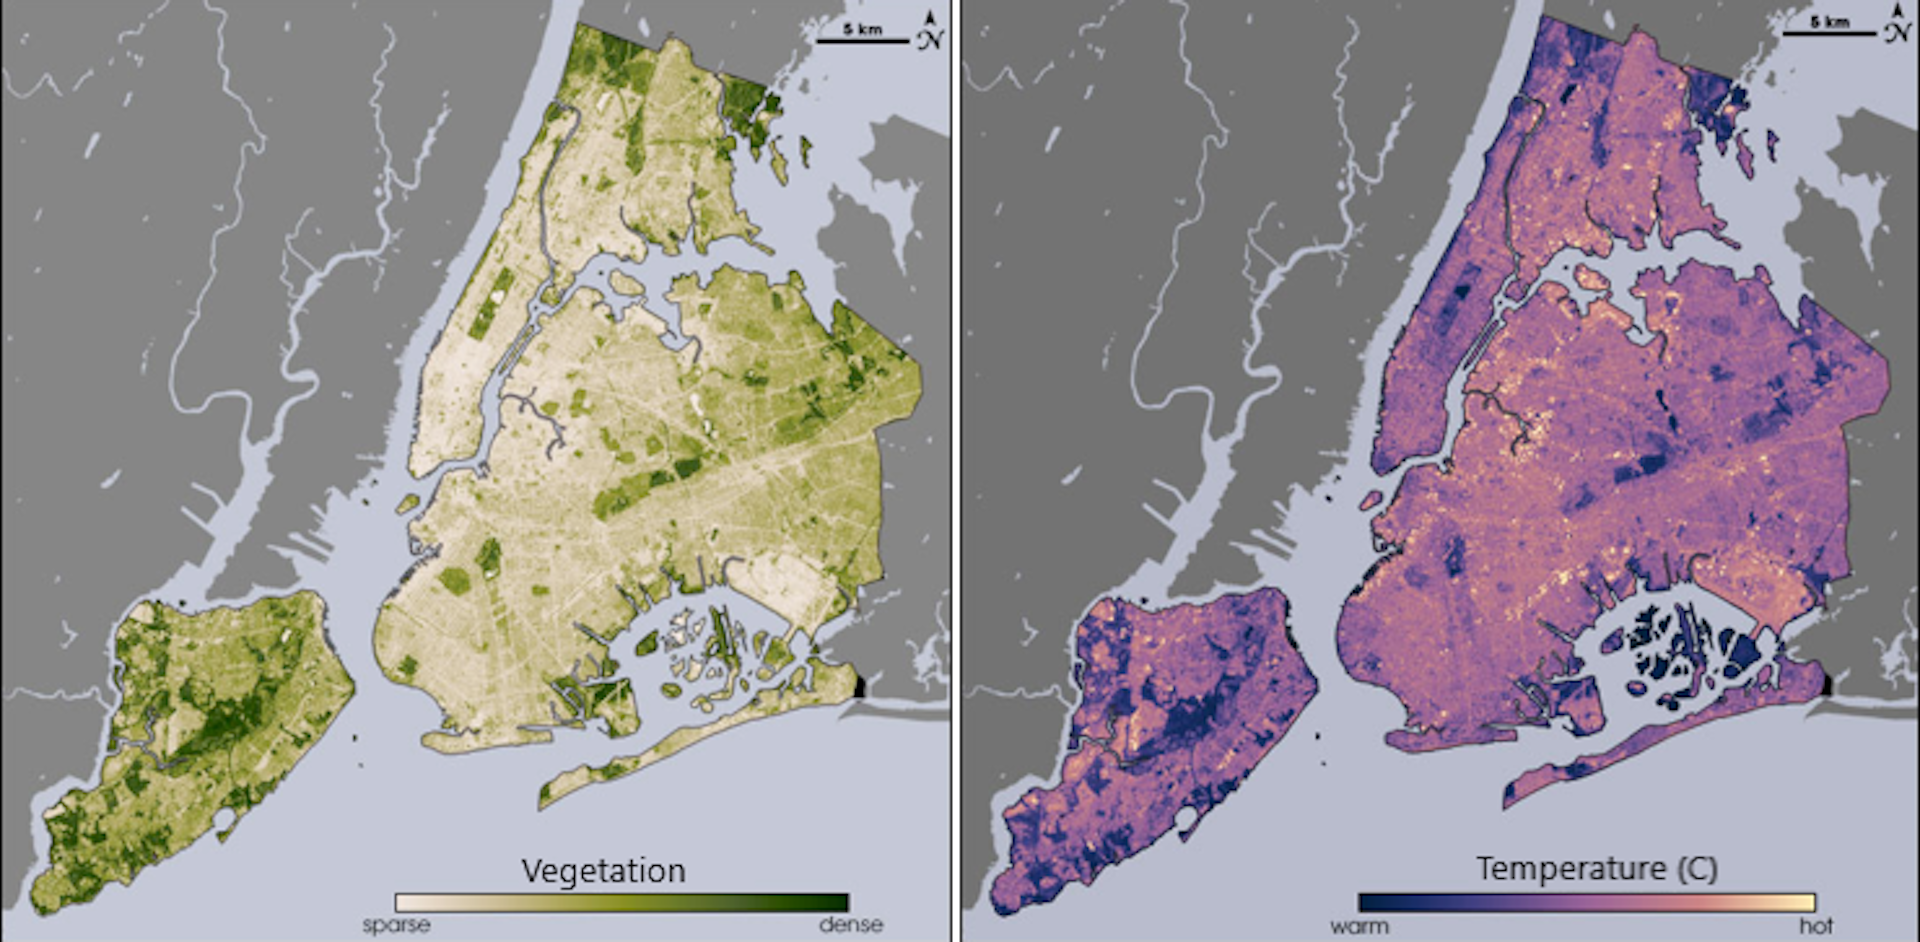
Green space, like forested parks, can also reduce temperature swings. Urban trees and vegetation can keep neighborhoods cooler, reducing the temperature volatility.
Who faces the greatest temperature swings?
Using NASA’s satellite data between 2000 and 2017, we cross-checked the daily temperature variation with the U.S. Census Bureau’s American Community Survey demographic data at different census tracts to see how race and ethnicity, income, and age affected exposure to daily temperature variations across all 50 states.
We found that, of the three demographic factors, exposure to daily temperature variation is the most unequal by race and ethnicity, followed by income. Age mattered the least.
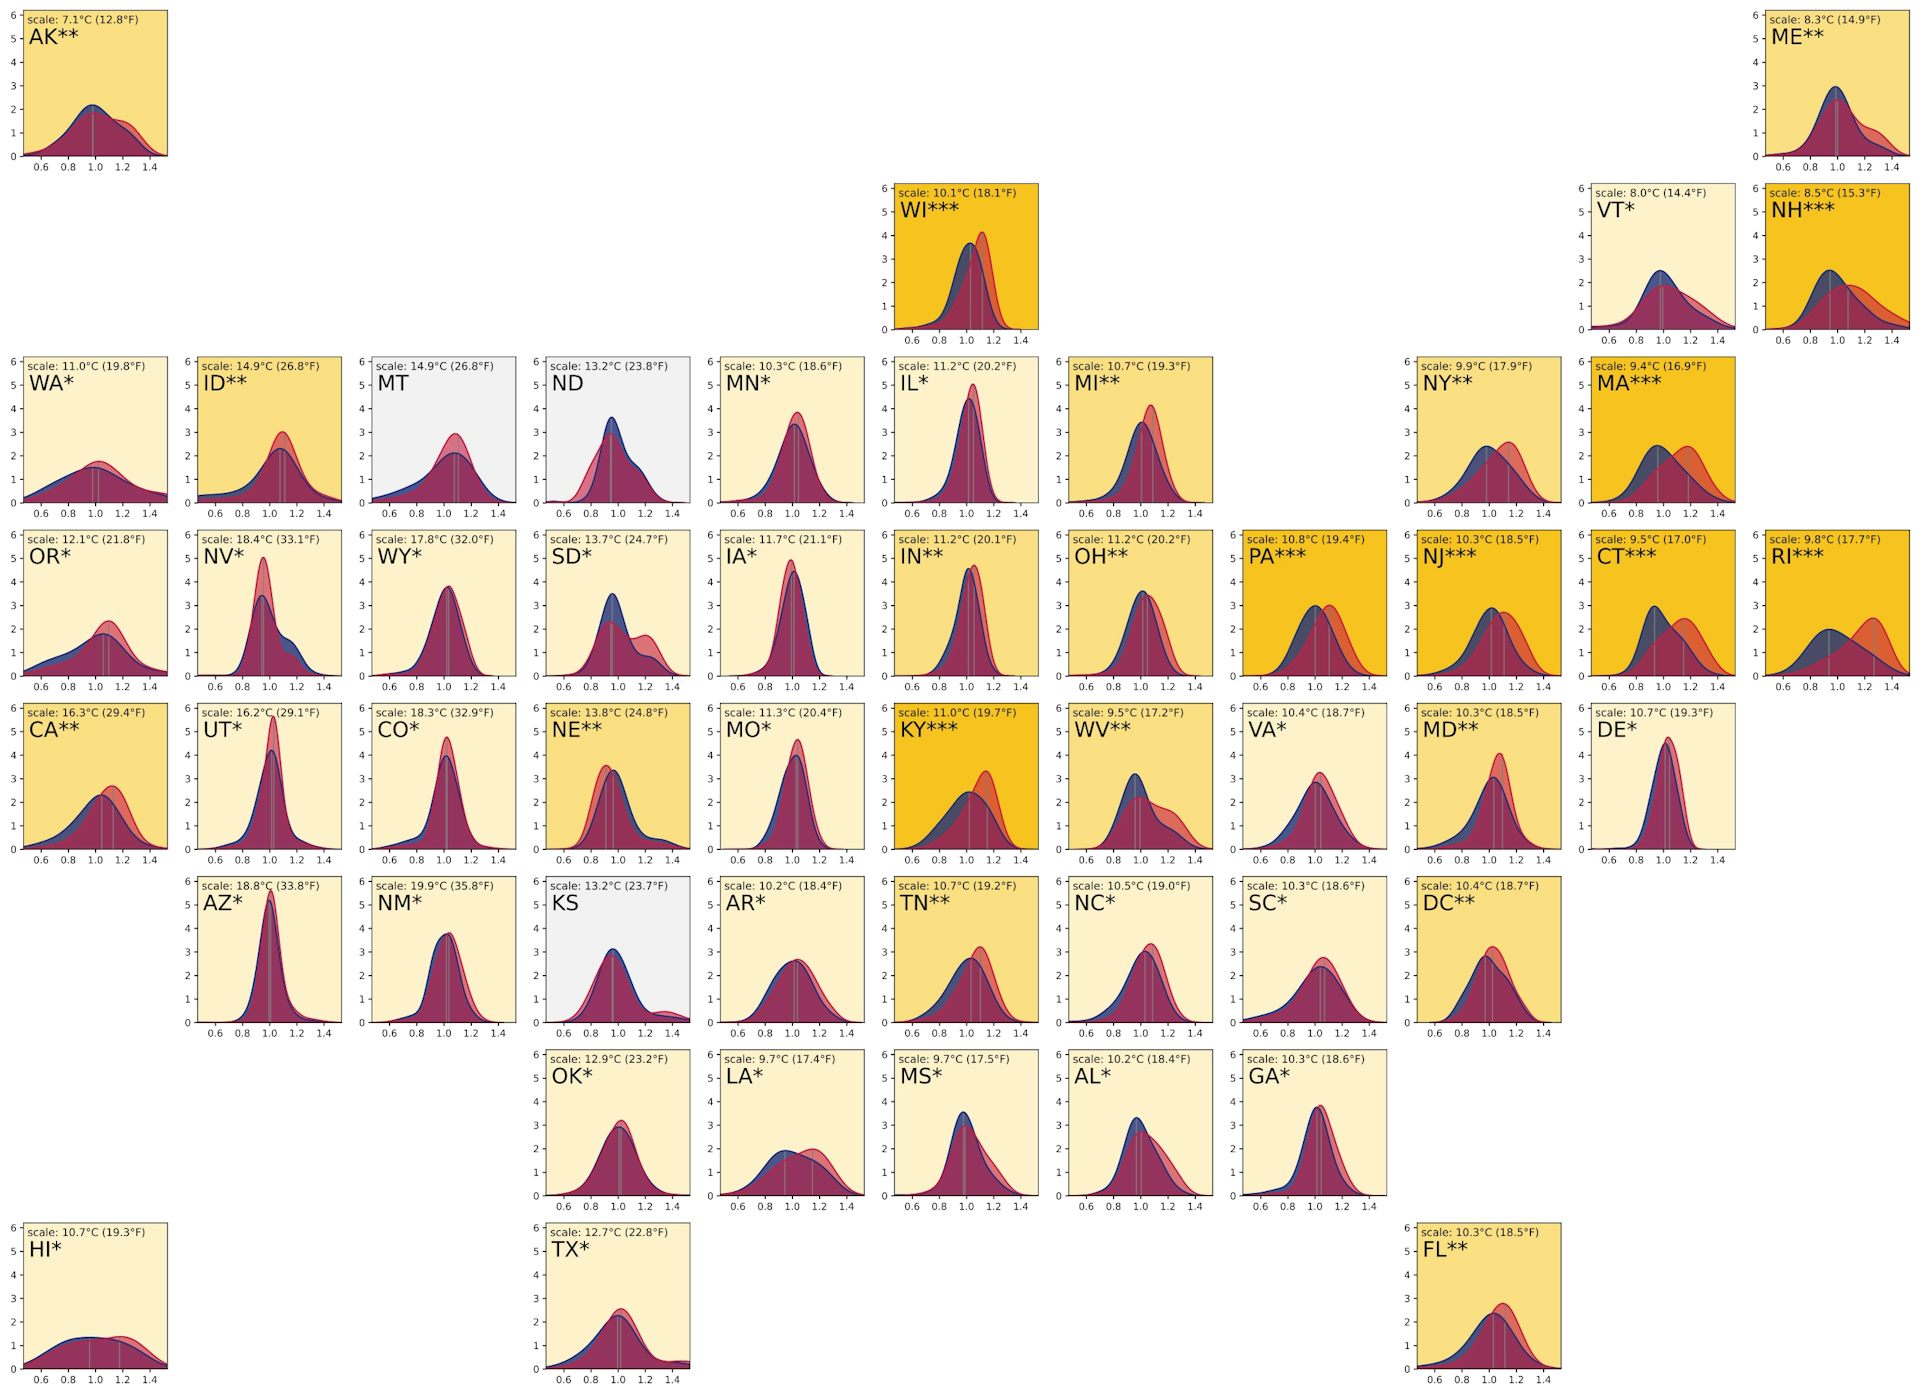
In the state with the greatest disparity, Rhode Island, Hispanic and Black populations experienced, on average, daily temperature swings of 31.2 degrees Fahrenheit (17.3 degrees Celsius) in May, while the average daily temperature variation for white populations was 25.8 F (14.3 C). That’s a 5.4 F (3 C) difference between the groups.
The contrast between low-income and high-income groups in Rhode Island was 28.6 F (15.9 C) compared with 24.5 F (13.6 C), a 4.1 F (2.3 C) difference. The difference was negligible among age groups, at 1.8 F (1 C).
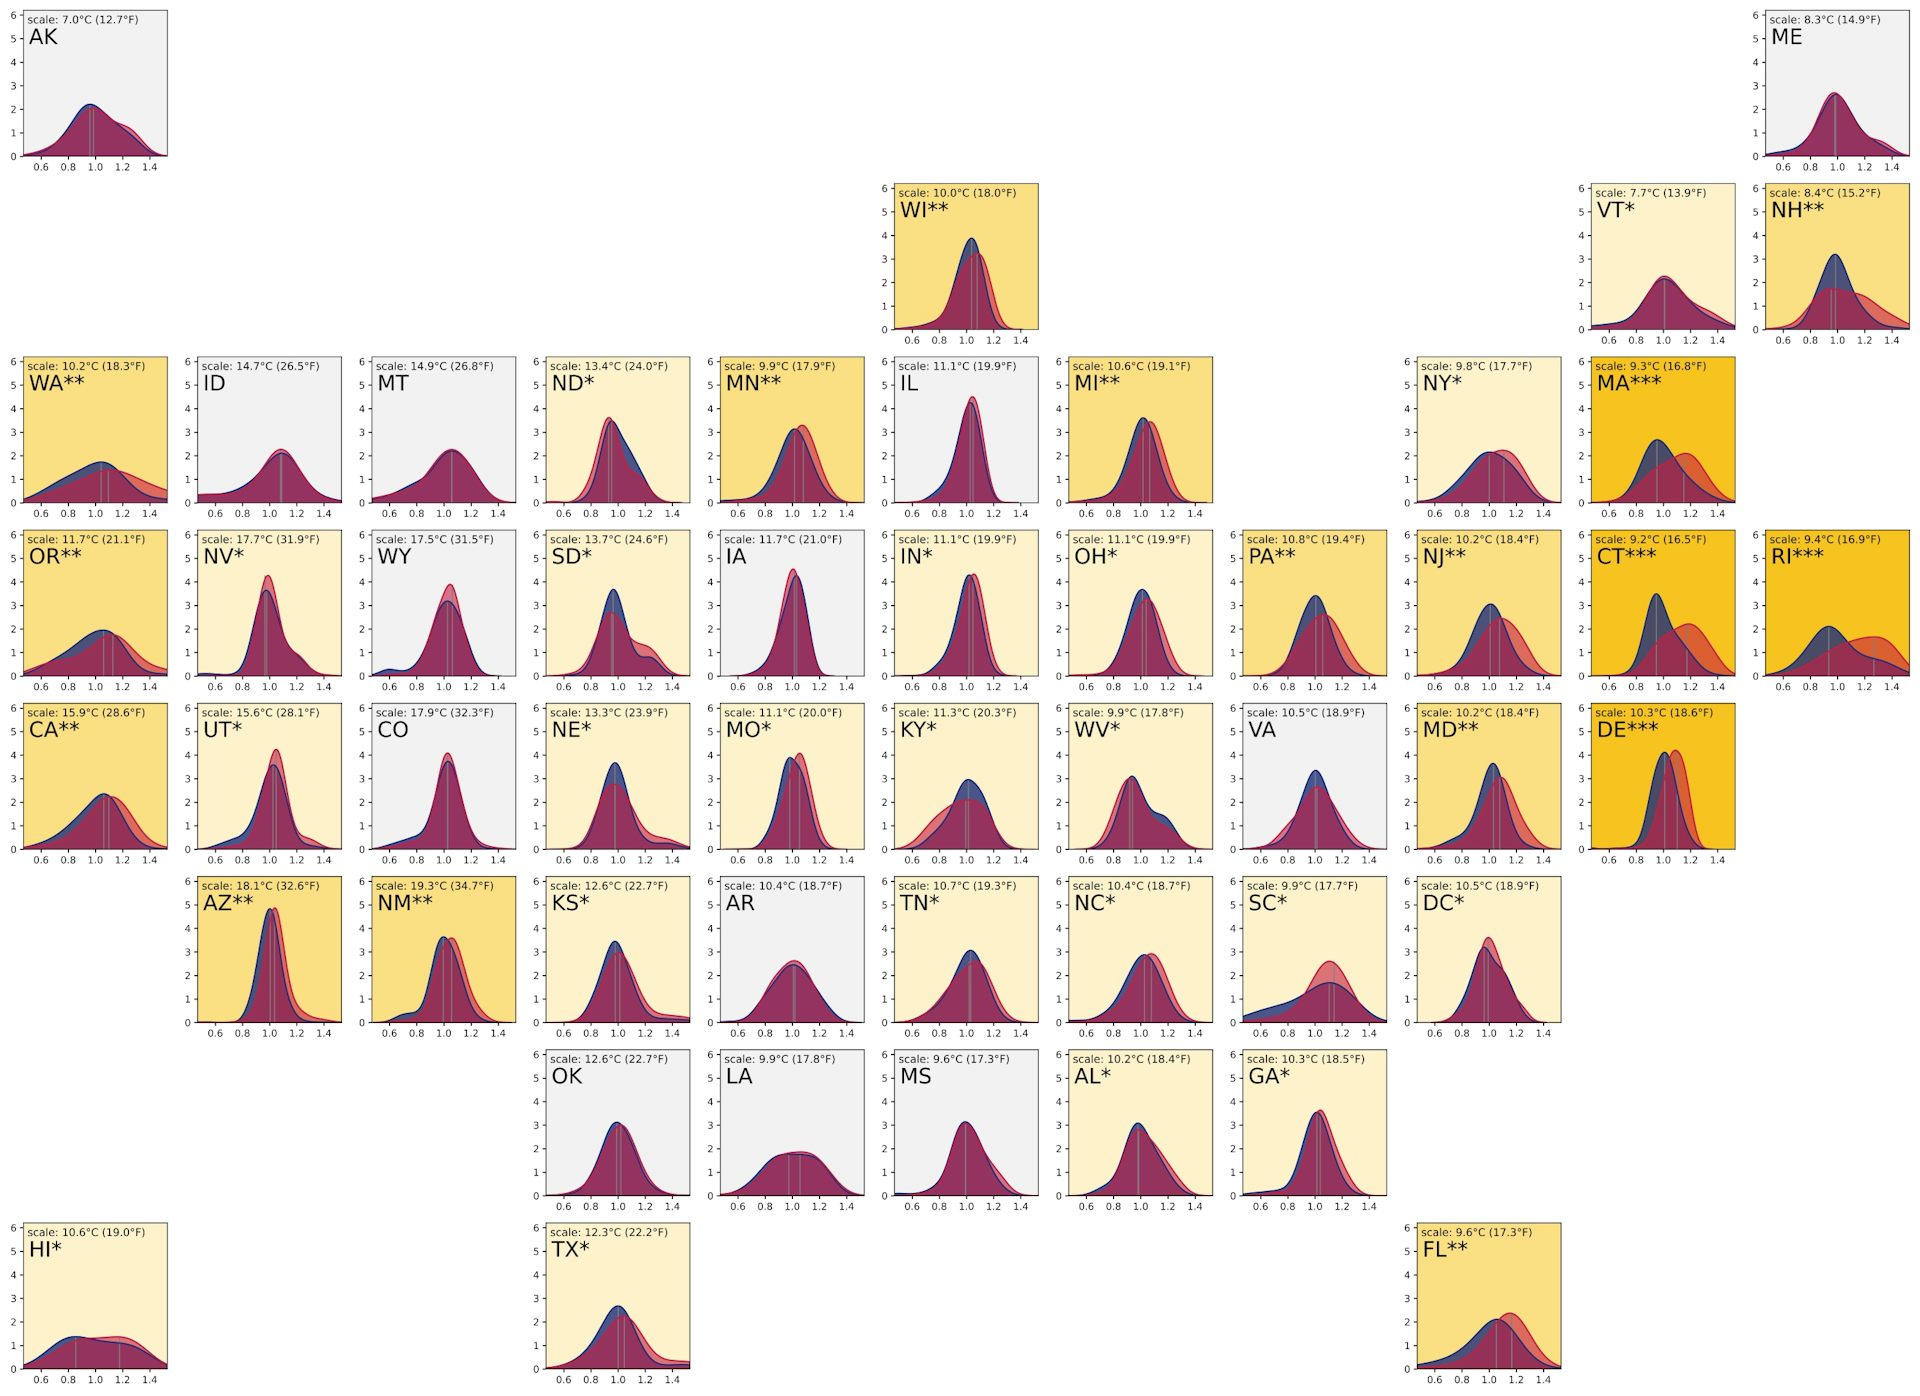
Among the 50 states, we saw significant differences by race and ethnicity in 46 states, by income in 39 states, and by age in 15 states. In general, daily temperature swings were highest in western states, particularly in late spring and summer.
The fact that minority populations are disproportionately living in neighborhoods with wider temperature swings confirms yet another dimension of inequality in vulnerability to climate change.
Temperature swings widen with climate change
There is also evidence that temperature swings will get more dramatic over time. From the 1950s to the 1980s, records show shrinking temperature swings globally. Since the 1990s, however, research shows temperature swings have widened, potentially affecting all life on Earth.
Studies suggest these temperature swings will continue to widen as greenhouse gas emissions, largely from burning fossil fuels, continue to raise global temperatures. And with those increases will come more premature deaths. Under the Intergovernmental Panel on Climate Change’s highest emissions scenario (RCP 8.5), which projects conditions in a world that burns increasingly large amounts of fossil fuels, future temperature swings are projected to increase by as much as 2.9 F (1.6 C) by the end of the century.
There are ways to reduce the risk, starting with cutting greenhouse gas emissions from vehicles, power plants, livestock and other sources.
Communities can also take steps to reduce low-income and minority neighborhoods’ exposure to temperature swings by increasing tree cover and using light coatings on roofs to reflect heat away from buildings. They can also provide support programs to help people who can’t otherwise afford to install or power cooling or heating equipment.![]()
Shengjie Liu, Ph.D. Candidate in Spatial Sciences, USC Dornsife College of Letters, Arts and Sciences and Emily Smith-Greenaway, Associate Professor of Sociology, USC Dornsife College of Letters, Arts and Sciences
This article is republished from The Conversation under a Creative Commons license. Read the original article.