USC study calculates air pollution levels in every L.A. neighborhood
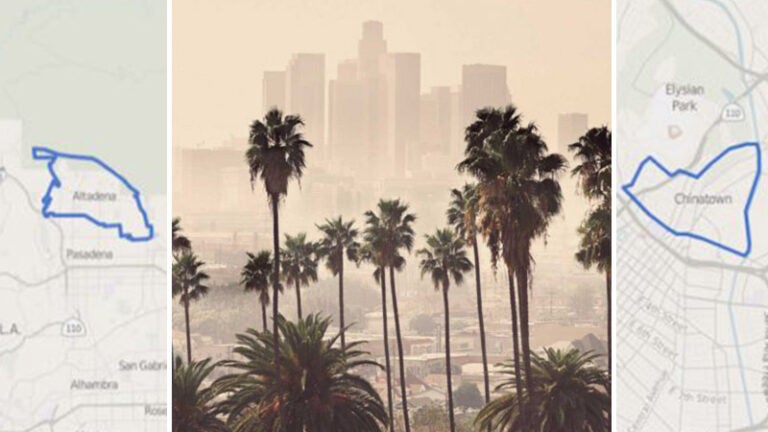
A new USC analysis of air quality data shows sharply different levels of air pollution across the Los Angeles area, with Chinatown suffering from the unhealthiest air. Altadena had the lowest air pollution.
The analysis used an artificial intelligence model, developed through collaborations at the university, that can measure particulate matter levels neighborhood by neighborhood. The analysis was performed by Crosstown, a new USC initiative that uses data to tell stories about quality of life issues in Los Angeles.
Crosstown, a joint project of USC’s Annenberg School for Communication and Journalism and the Integrated Media Systems Center at the USC Viterbi School of Engineering, used an artificial intelligence model developed with the Spatial Sciences Institute at USC Dornsife. USC Information Sciences Institute and Keck School of Medicine of USC collaborated on the project, as well.
A tiny health threat
The analysis tracked measurements of a very fine particulate, PM2.5, which has a diameter of 2.5 micrometers or less. Thirty of these microscopic particles would fit across the width of a human hair. PM2.5 is one factor used in calculating the Air Quality Index.
These particulates are a health threat in part because, after they are inhaled through the nose, they easily pass directly into the brain, crossing the blood-brain barrier undetected. The blood-brain barrier is the brain’s natural shield against harmful viruses and bacteria.
Generated by vehicle engines and power plants, PM2.5 has been linked to a variety of health issues, including high rates of asthma, as well as dimentia and Type 2 diabetes in some populations.
Crosstown looked at PM2.5 levels across L.A. County between November 2016 and October 2017. Measurements were updated hourly, for more than 6,800 readings in total. PM2.5 particulate measurements were taken from 251 neighborhoods and cities in L.A. County, then converted into the Air Quality Index scale using Crosstown’s methodology.
“Our data mining approach uses machine learning techniques to learn from the observed data of air quality and our built environment to find the critical components that impact PM2.5,” said Yao-Yi Chiang, associate professor of spatial sciences at USC Dornsife and associate director at the USC Viterbi School’s IMSC. “Our finding shows that we can predict PM2.5 for any location in Los Angeles with a high degree of accuracy.”
Where it’s at
Among all L.A. neighborhoods, Chinatown has the highest risk of unhealthy air. Its rating rose into the range considered unhealthy for sensitive groups 147 times during the year studied, followed by Downtown L.A., Lincoln Heights and Echo Park.
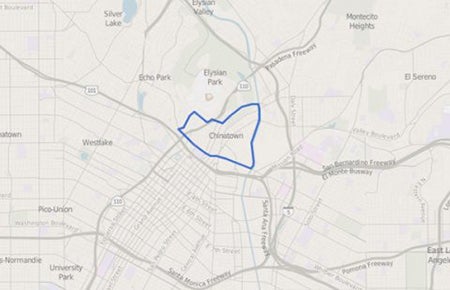
Chinatown is among the areas of Los Angeles shown to have high areas of pollution. Graphic courtesy of Gabriel Kahn.
Neighborhoods that are quite a distance from L.A.’s core have cleaner air. The area with the most hours of healthy air was Altadena, at the foot of the San Gabriel Mountains. A close second is 20 miles east — Glendora, also near the Angeles National Forest.
“It’s essential that citizens understand how air quality can fluctuate in different parts of the city,” said Gabriel Kahn, professor of professional practice at the USC Annenberg School. “Providing this kind of granular detail can allow asthma sufferers, people with respiratory problems and folks who just like to exercise outdoors the kind of information that can make a difference for their health.”
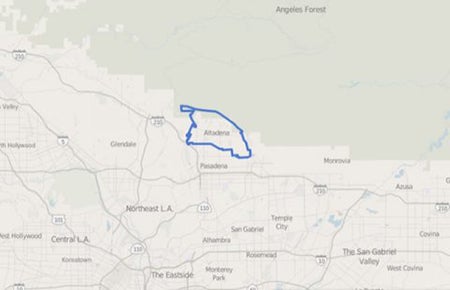
Among the neighborhoods in the Los Angeles area with the cleanest air was Altadena. Graphic courtesy of Gabriel Kahn.
Air quality calculations
Crosstown deploys a particular methodology to derive air quality ratings at the neighborhood level. It aggregates hyperlocal air quality predictions from an artificial intelligence model, Jon Snow, developed by the Spatial Sciences Institute. This peer-reviewed model takes hourly readings of atmospheric PM 2.5 levels from the 12 reporting sites of the Environmental Protection Agency and the South Coast Air Quality Management District located throughout L.A. County.
The readings are then run through the data mining engine in JonSnow. They account for the surrounding geographic context of every neighborhood or area in Los Angeles County. The software then generates a “geographic abstraction” for each reporting site automatically that describes the neighborhood environment for a given location.
The geographic abstraction also takes the built environment into consideration by using data from a free-to-the-public mapping platform, OpenStreetMap (OSM). The length of various road types, the area of open spaces and other similar factors are combined with air quality data to generate estimates for specific neighborhoods.
Visit the Crosstown website for a more detailed explanation of the methodology. Support for Crosstown comes from the Annenberg Foundation.