
Carbon Cycle Research
Research over the past three decades has shown that each of the major ice ages during the late Pleistocene was accompanied by systematic changes atmospheric CO2 that tracked changes in air temperature and global ice volume (Figure 1). After several decades of research, the reason for the variations in atmospheric CO2 remains an open question.
At the end of the last ice age atmospheric pCO2 began to rise rapidly starting at 17ky BP (Figure 1). This was accompanied by a drop in atmosphere and ocean ∆14C (radiocarbon activity) (Figure 2). The drop in ∆14C cannot be explained by changes in 14C production alone and therefore requires there to have been a flux of 14C-depleted carbon into the surface ocean and atmosphere. The long-standing paradigm states that both the rise in atmospheric pCO2 and the drop in ∆14C during the deglaciation was caused solely by a release of ‘old’ respired metabolic carbon that had accumulated in the deep sea during the long glaciation. However, research conducted at USC (Stott et al., 2021; Stott et al., 2023) and elsewhere has shown that excess accumulations of respired carbon in the deep ocean is not supported by observations and therefore, the drop in ∆14C and the rise in atmospheric CO2 must involve other Earth System processes.
Over the past two decades a number of important discoveries have been made that are shedding new light on the processes responsible for the drop in ∆14C and the rise in atmospheric pCO2 that accompanied the last deglaciation. Paleoceanographers have documented large ∆14C excursions in marine sediments (Figure 2) that coincide with the last deglaciation and drop in atmospheric ∆14C (e.g. Stott et al, 2009, Stott and Timmermann, 2011, Stott et al., 2019a, Stott et al., 2019b). Thus far these marine ∆14C excursions have been documented at sites in the eastern equatorial Pacific (EEP), the Arabian Sea, the Baja margin and in the South Pacific, including sites on the Chatham Rise and Bounty Trough near New Zealand. There may be many more locations that have not yet been found.
The magnitude of the deglacial ∆14C excursions in places such as the eastern equatorial Pacific cannot be reconciled with a release of metabolic respired carbon from the deep sea. This is because if the radiocarbon ages in the EEP cores reflected ‘true’ ventilation age of Pacific Intermediate waters, those waters would have been more than 6000 years old during the last deglaciation. And if that had been true, those waters would have been anoxic and there is no evidence of anoxia in the EEP during the last deglaciation. These large ∆14C excursions reflect a release of geologic (very old) carbon to the upper ocean.
The acquisition of these new observations leads to a new hypothesis that would explain the ∆14C anomalies and the systematic variations in atmospheric CO2 that accompanied the ice ages during the Pleistocene.
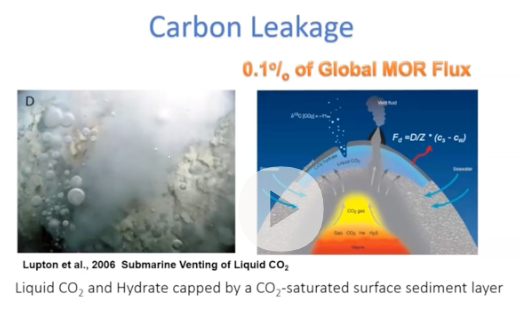
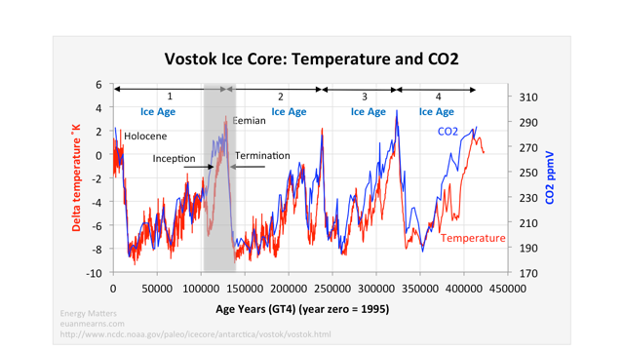
Figure 1. Figure above depicts the history of air temperatures over Antarctica (red) and atmospheric CO2 (blue). Note the close correspondence between the variations in temperature and atmospheric CO2. The last deglaciation began 17ky BP. Note how rapidly air temperatures and CO2 rose during the deglaciation.
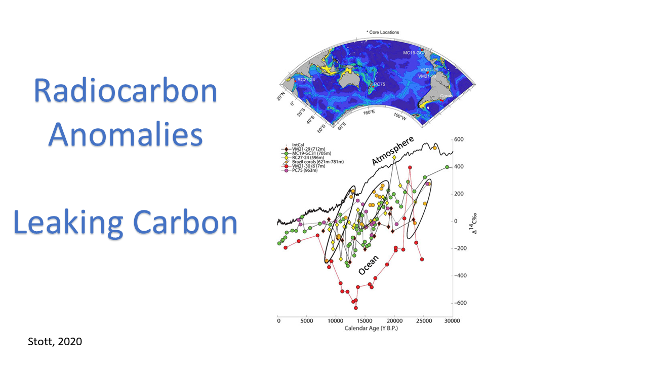
Figure 2. The black line in the graph shows the history of atmospheric ∆14C (the amount of radiocarbon relative to modern). Note the decline from ~30ky BP to the modern. The colored lines are reconstructed records of marine ∆14C. The map depicts the locations where the marine cores were collected. The large ∆14C excursions during the last deglaciation are a clear fingerprint of geologic carbon release to the upper ocean.
Investigating the predicatability of drought
We are conducting research to investigate the predictability of hydroclimate variability, particularly drought on decadal time scales.
The southwestern US experienced several decadal-length droughts during the 20th century. The recurrence of drought constitutes a major challenge to resource managers who must plan for adequate water resources for a growing population. But predicting when drought will occur and how long it will persist is not yet possible. Our goal is to develop methods that will lead to a better understanding of the causes of drought and extreme precipitation variability.
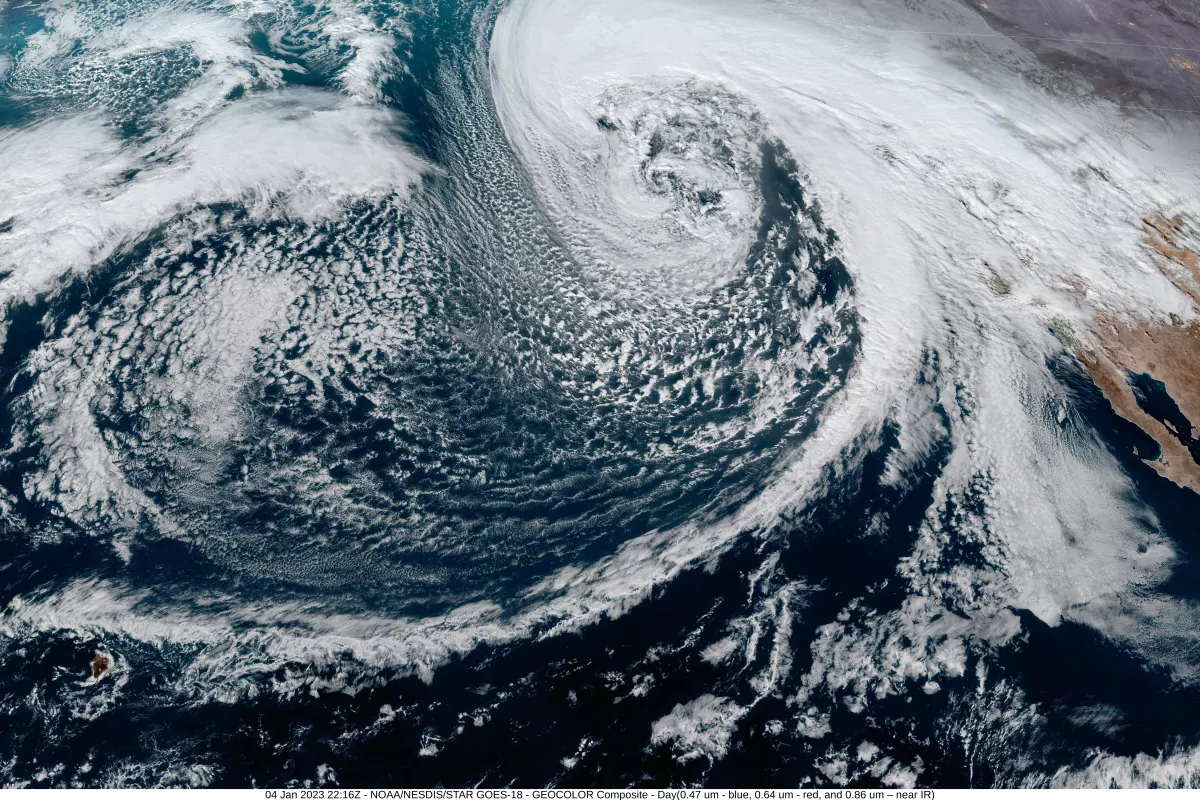
We use the stable isotope composition of precipitation (δ18O and δD) that falls over the southwest to fingerprint sources of atmospheric moisture. This tracer approach is possible because the precipitation from storms that originate in the North Pacific has a δ18O compoistion that is 4 to 8‰ lower than the precipitation from subtropical storms. We assess how these sources of moisture change in response to varying atmospheric behavior and how contributions of moisture from these sources changes during periods of drought. This information is being used to evaluate climate model experiments that are designed to evaluate what factors may cause drought, including changing sea surface temperature changes that may accompany a warming climate. There are other factors that influence the isotopic composition of precipitation over California, and decipher the primary influences on the isotopic variability is a major portion of the work we are doing (Berkelhammer et al., 2013, Buenning et al., 2013, Kanner et al., 2013, Buenning et al., 2012, Berkelhammer et al., 2012, Berkelhammer and Stott, 2012)
Climate models used to assess how the climate system will respond to rising greenhouse gas concentrations simulate northward dispacement of winter season storm tracks. Such a shift is expected to reduce the number of North Pacific storms (with lower isotopic values) reaching California. Hence, we expect a warming climate to increase the average isotope ratio of precipitation over California because the proportion of tropical moisture will increase. We are establishing a transect of precipitation monitoring stations along the west coast of North America that will collect precipitation samples for isotope measurement. These samples will be used to test climate model simulations we use to investigate storm track behavior. Ultimately, we hope to improve the ability of models to simulate the climated behavior over western North America and in doing so, aid efforts to plan appropriately for the region’s water needs.
References:
2013 Berkelhammer, M. Sinha, A., Stott, L., Cheng, H., Pausata, F. and Yoshimura, K. An abrupt shift in Indian Monsoon precipitation 4,000 years ago. Geophysical Monograph, Climates, Landscapes, and Civilizations, 75-88.
2013 Kanner, L., N. Buenning, L. Stott, and D. Stahle, Climatologic and hydrologic influences on the oxygen isotope ratio of tree cellulose in coastal southern California during the late 20th century, Geochem. Geophys. Geosyst., 14, doi:10.1002/ggge.20256.
2013 Buenning, N.H., Stott, L., Kanner, L., Yoshimura, K., Diagnosing Atmospheric Influences on the Interannual 18O/16O Variations in Western U.S. Precipitation. Water, 5(3), 1116-1140; doi:10.3390/w5031116.pdf
2012 Buenning, N., Stott, L., Yoshimura, K., Berkelhammer, M.. The cause of the seasonal variation in the isotopic composition of precipitation along the western US coast. Journal of Geophysical Research.117, D18114, doi: 10.1029/2012JD018050
2012 Berkelhammer, M., Stott, L., Yoshimura, K., Sinha, A., and K. Johnson. Synoptic and mesoscale controls on the isotopic composition of precipitation in the western United States, Climate Dynamics. 38, 3-4, Pages 433-454
2012 Berkelhammer, M. and Stott, L. Secular temperature trends for the southern Rocky Mountains over the last five centuries. Geophysical Research Letters. 39, L17701, doi: 10.1029/2012GL052447