Thinking Ahead
At USC Dornsife, “What if?” becomes what’s next.
Our researchers take the lead in fields that are just beginning to reveal tremendous promise. By investing in emerging areas of scholarship — from quantum computing to climate change communication to the frameworks for developing ethical A.I. — new possibilities become more than aspirations; they unfold in real-time, right here.
Free Lead Soil Testing Helps L.A. Residents After Wildfires
Anyone affected by the L.A. fires can drop off or mail in soil samples for testing by USC Dornsife researchers as part of Public Exchange’s community-focused project to assess post-fire lead contamination.

Lead in Your Soil? What L.A. Fire Victims Must Know
Earth Month @ USC Dornsife
Here’s a look at recent news and upcoming events focusing on environmental issues.
News & Events
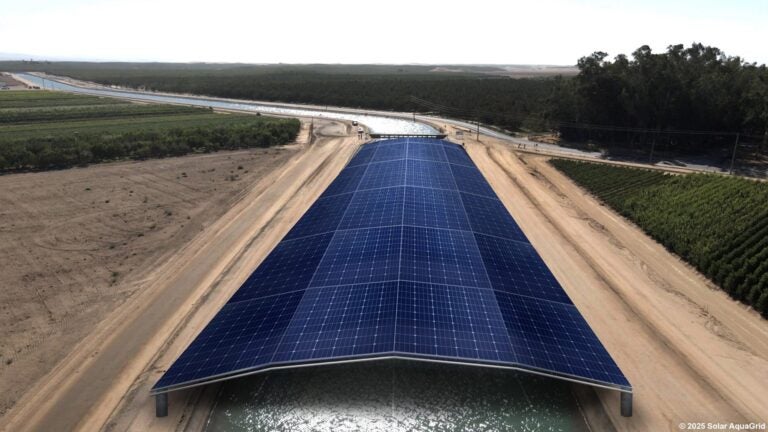
‘Solar canals’: A bright solution for California’s water and energy needs?
Organized by USC Dornsife’s Public Exchange, the USC-led California Solar Canal Initiative could transform major portions of the state’s 4,000 miles of canals into a powerful source of clean energy and water conservation.
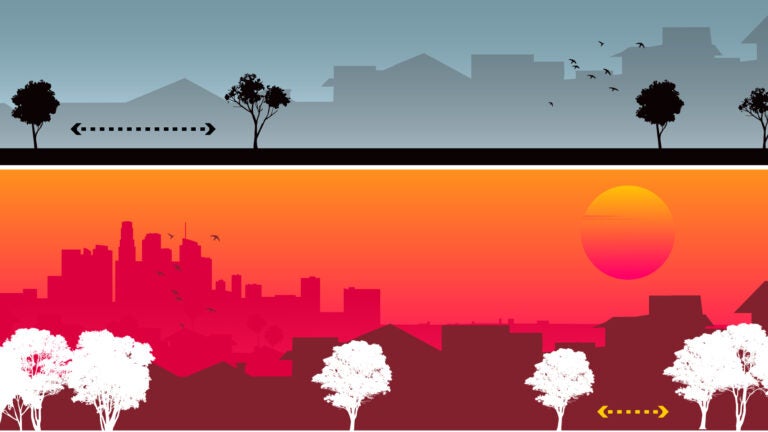
How changing L.A.’s tree rules could cool more neighborhoods
A new USC Dornsife study finds that outdated guidelines are limiting tree growth — especially in lower-income neighborhoods — and offers a path forward.
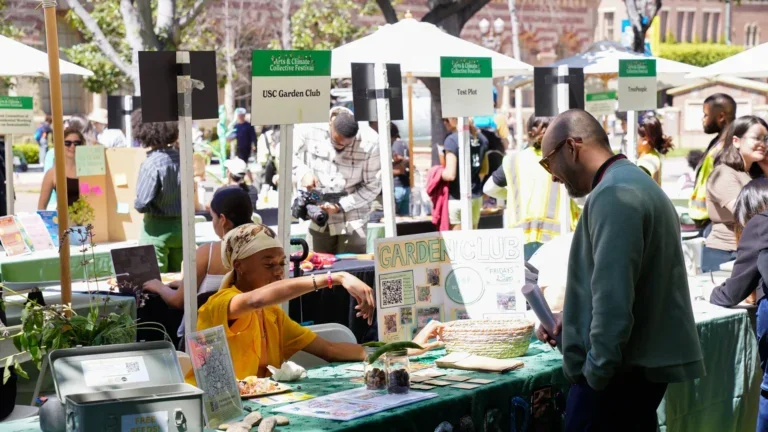
Mark your calendar for USC Earth Month events
More than 60 events are planned across USC campuses throughout April, many featuring USC Dornsife faculty or hosted by Dornsife centers and institutes.

April 3: Climate Forward Conference
In celebration of Earth Month, join the USC Wrigley Institute for Environment and Sustainability and the USC Dornsife Center for the Political Future for a series of conversations advancing climate change issues.
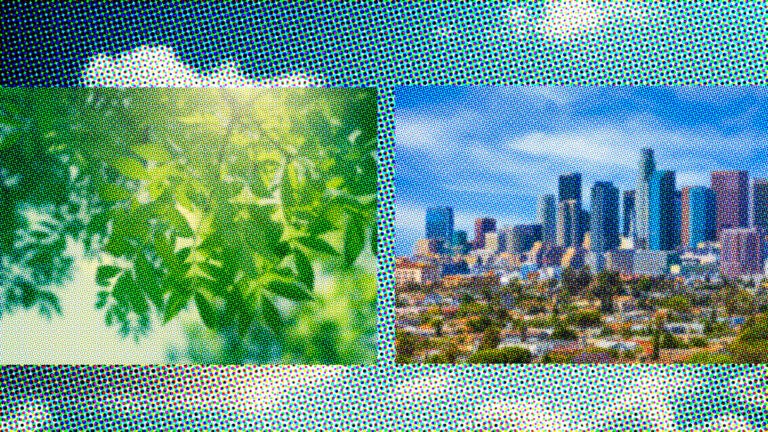
L.A.’s urban trees absorb more carbon than expected, USC Dornsife study finds
Scientists, using a network of air-quality sensors, find that the city’s urban greenery offsets fossil fuel emissions more than expected, offering insights that could help cities fight climate change.
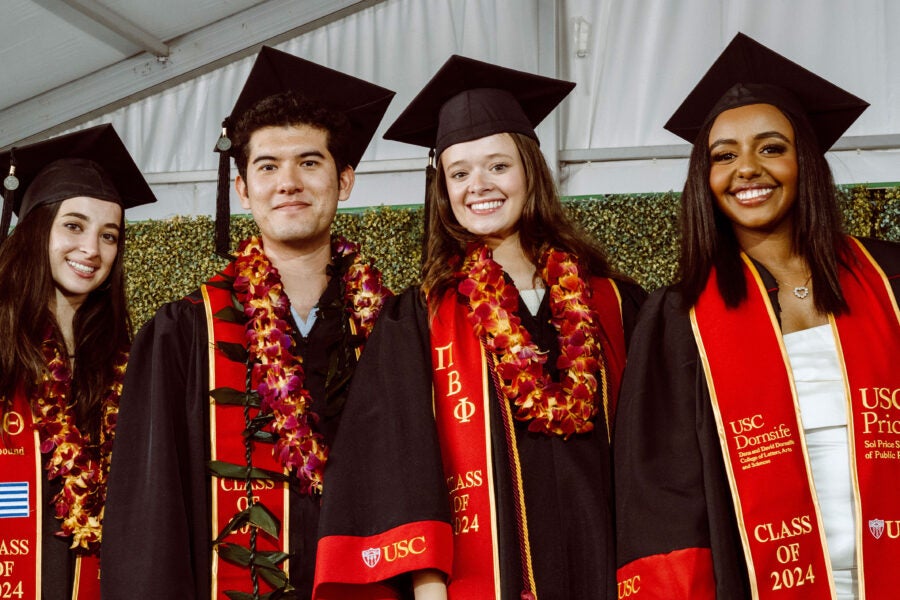
Celebrating the Class of 2025
Find everything you need to know about the
USC Dornsife Academic School Ceremony
on Friday, May 16, 2025.
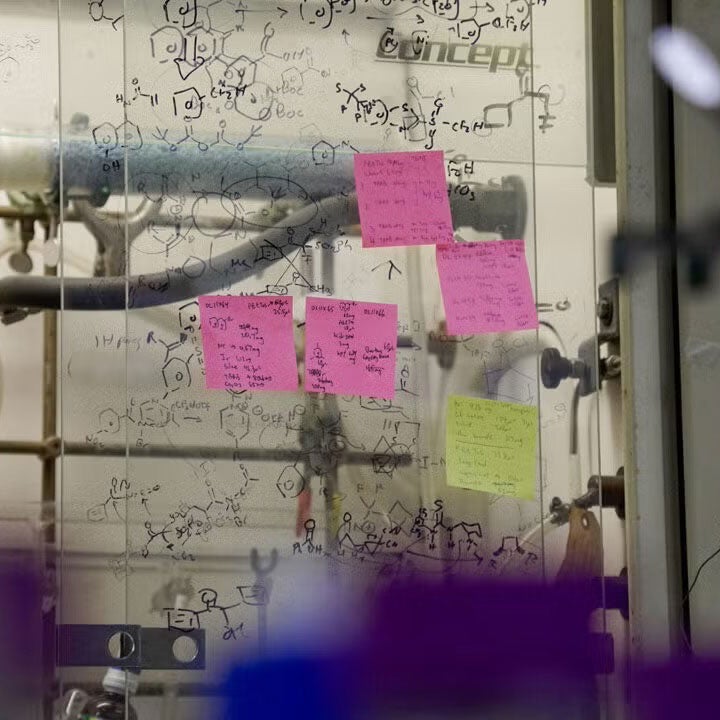
$15M Gift from Alumnus Fuels Sustainable Energy Research at USC Dornsife’s Loker Institute
The USC Loker Hydrocarbon Research Institute will use the donation from chemists and entrepreneurs Massoud Arvanaghi ’82 and Ferial K. Arvanaghi to drive research aimed at building a more sustainable future and a healthier environment.
USC Dornsife Professors Join Prestigious Ranks of AAAS Fellows
Election by their peers recognizes four scholars for pioneering research on microbial systems, nanoscale physics and chemistry, and sensory neurobiology.

Curiosity at Work


Stand Out, Together
At USC Dornsife you’ll study the things you love the most. You’ll explore ideas that you’ve never thought about before. You’ll learn how to make sense of the world from all different angles. And, as part of our community, you will help to define a dynamic academic environment focused on improving lives and the world around us.
Meet the Students
USC Dornsife students demonstrate an impressive combination of academic excellence, accomplishment, creativity, and hard work. Each and every student is hand-selected because they bring something special and unique to our community.

A Brighter Future
Isabella Pangilinan Environmental Studies majorUSC Dornsife student Isabella Pangilinan is passionate about finding solutions to some of our world’s most pressing challenges. The multidisciplinary courses offered through her major are preparing her for a career in environmental law.
The Power of “And”
Joshua Senior Biological Sciences major, East Asian Languages and Cultures minorUSC Dornsife student Joshua Senior is studying to become a neurosurgeon. He explains how his liberal arts education at USC Dornsife prepares him for his career goals – and for life.
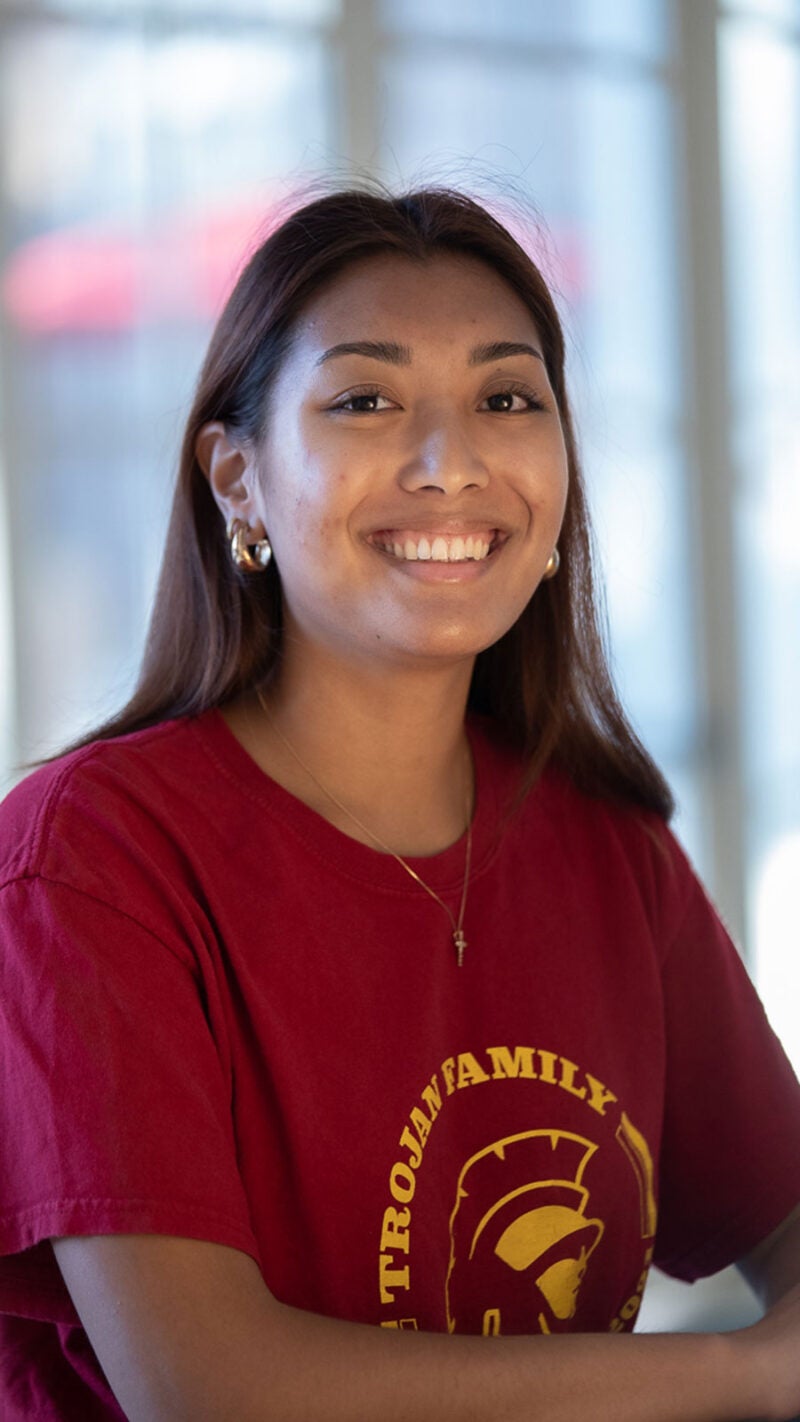
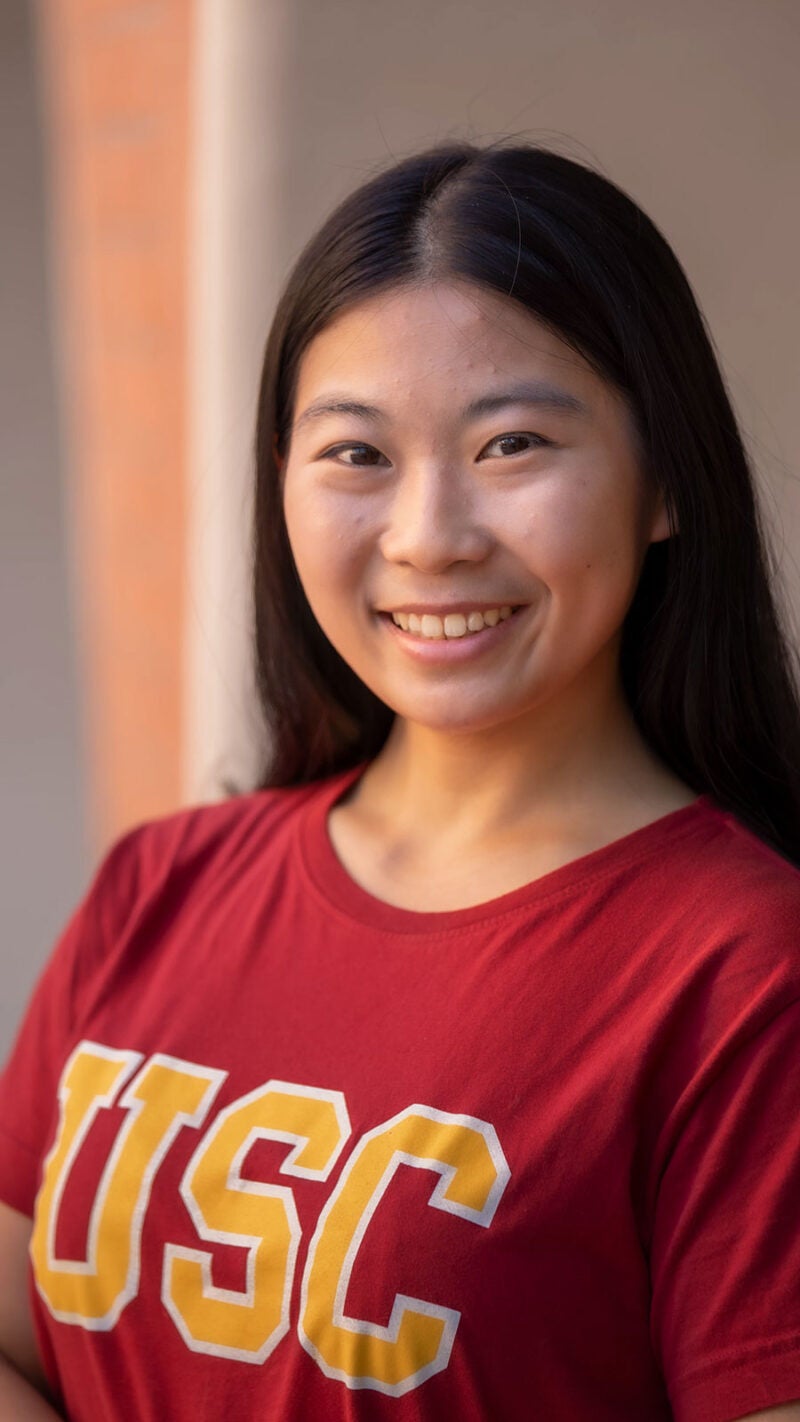
A Trojan Family Like No Other
Victoria Quon-Chow Human Biology major, Nutrition and Health Promotion minorAs a student at USC Dornsife, Victoria Quon-Chow is bouyed by the support of the Trojan Family as she prepares to become a doctor.
Unprecedented Access to Academic Expertise
Public Exchange fast-tracks collaboration between academic researchers and the public and private sectors to define, analyze, and solve complex problems that organizations face. Through our first-of-kind model, we amplify social impact by making academic expertise more easily accessible than ever before.
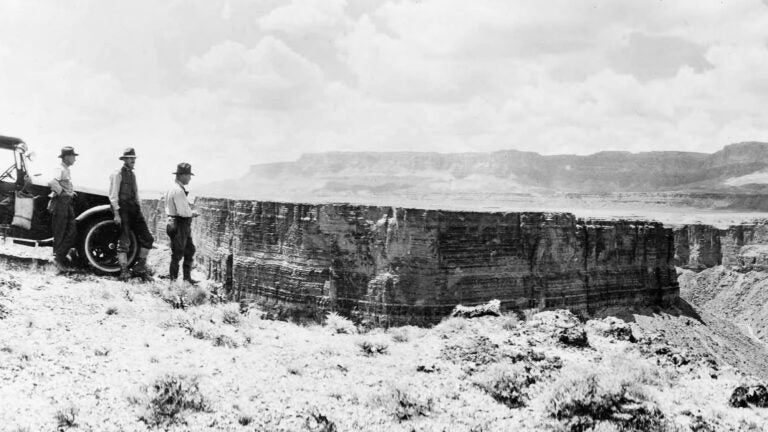
Stand Out With Purpose


The Golden State offers myriad stories, each revealing a new facet of its character. Learn more in the Fall/Winter issue of USC Dornsife Magazine.

USC Dornsife
NorCal alumni! Join us as USC Dornsife brings innovation and discovery to the heart of Silicon Valley. Interim Dean Moh El-Naggar will share insights into the future of interdisciplinary research and how Dornsife scholars are shaping the world through science, technology, and the humanities.
Connect with fellow alumni, parents, and faculty while celebrating the impact of a Dornsife education. Enjoy an evening of engaging conversation, hosted drinks and heavy appetizers.