Still riding L.A.’s Metro after the pandemic? You probably think it’s safer than those who don’t anymore
Key findings:
Ridership on Los Angeles’ public transit is still struggling to return to pre-pandemic levels.
84% of L.A. residents think riding Metro trains is currently unsafe — up from 76% pre-pandemic.
More than 80% of those who stopped riding after COVID think the trains are unsafe today, while fewer of those who returned think they’re unsafe.
Frequent riders view public transit as safer than occasional users.
While electric vehicle and solar panel sales are up, the driving force is financial means and savings, not climate change concerns.
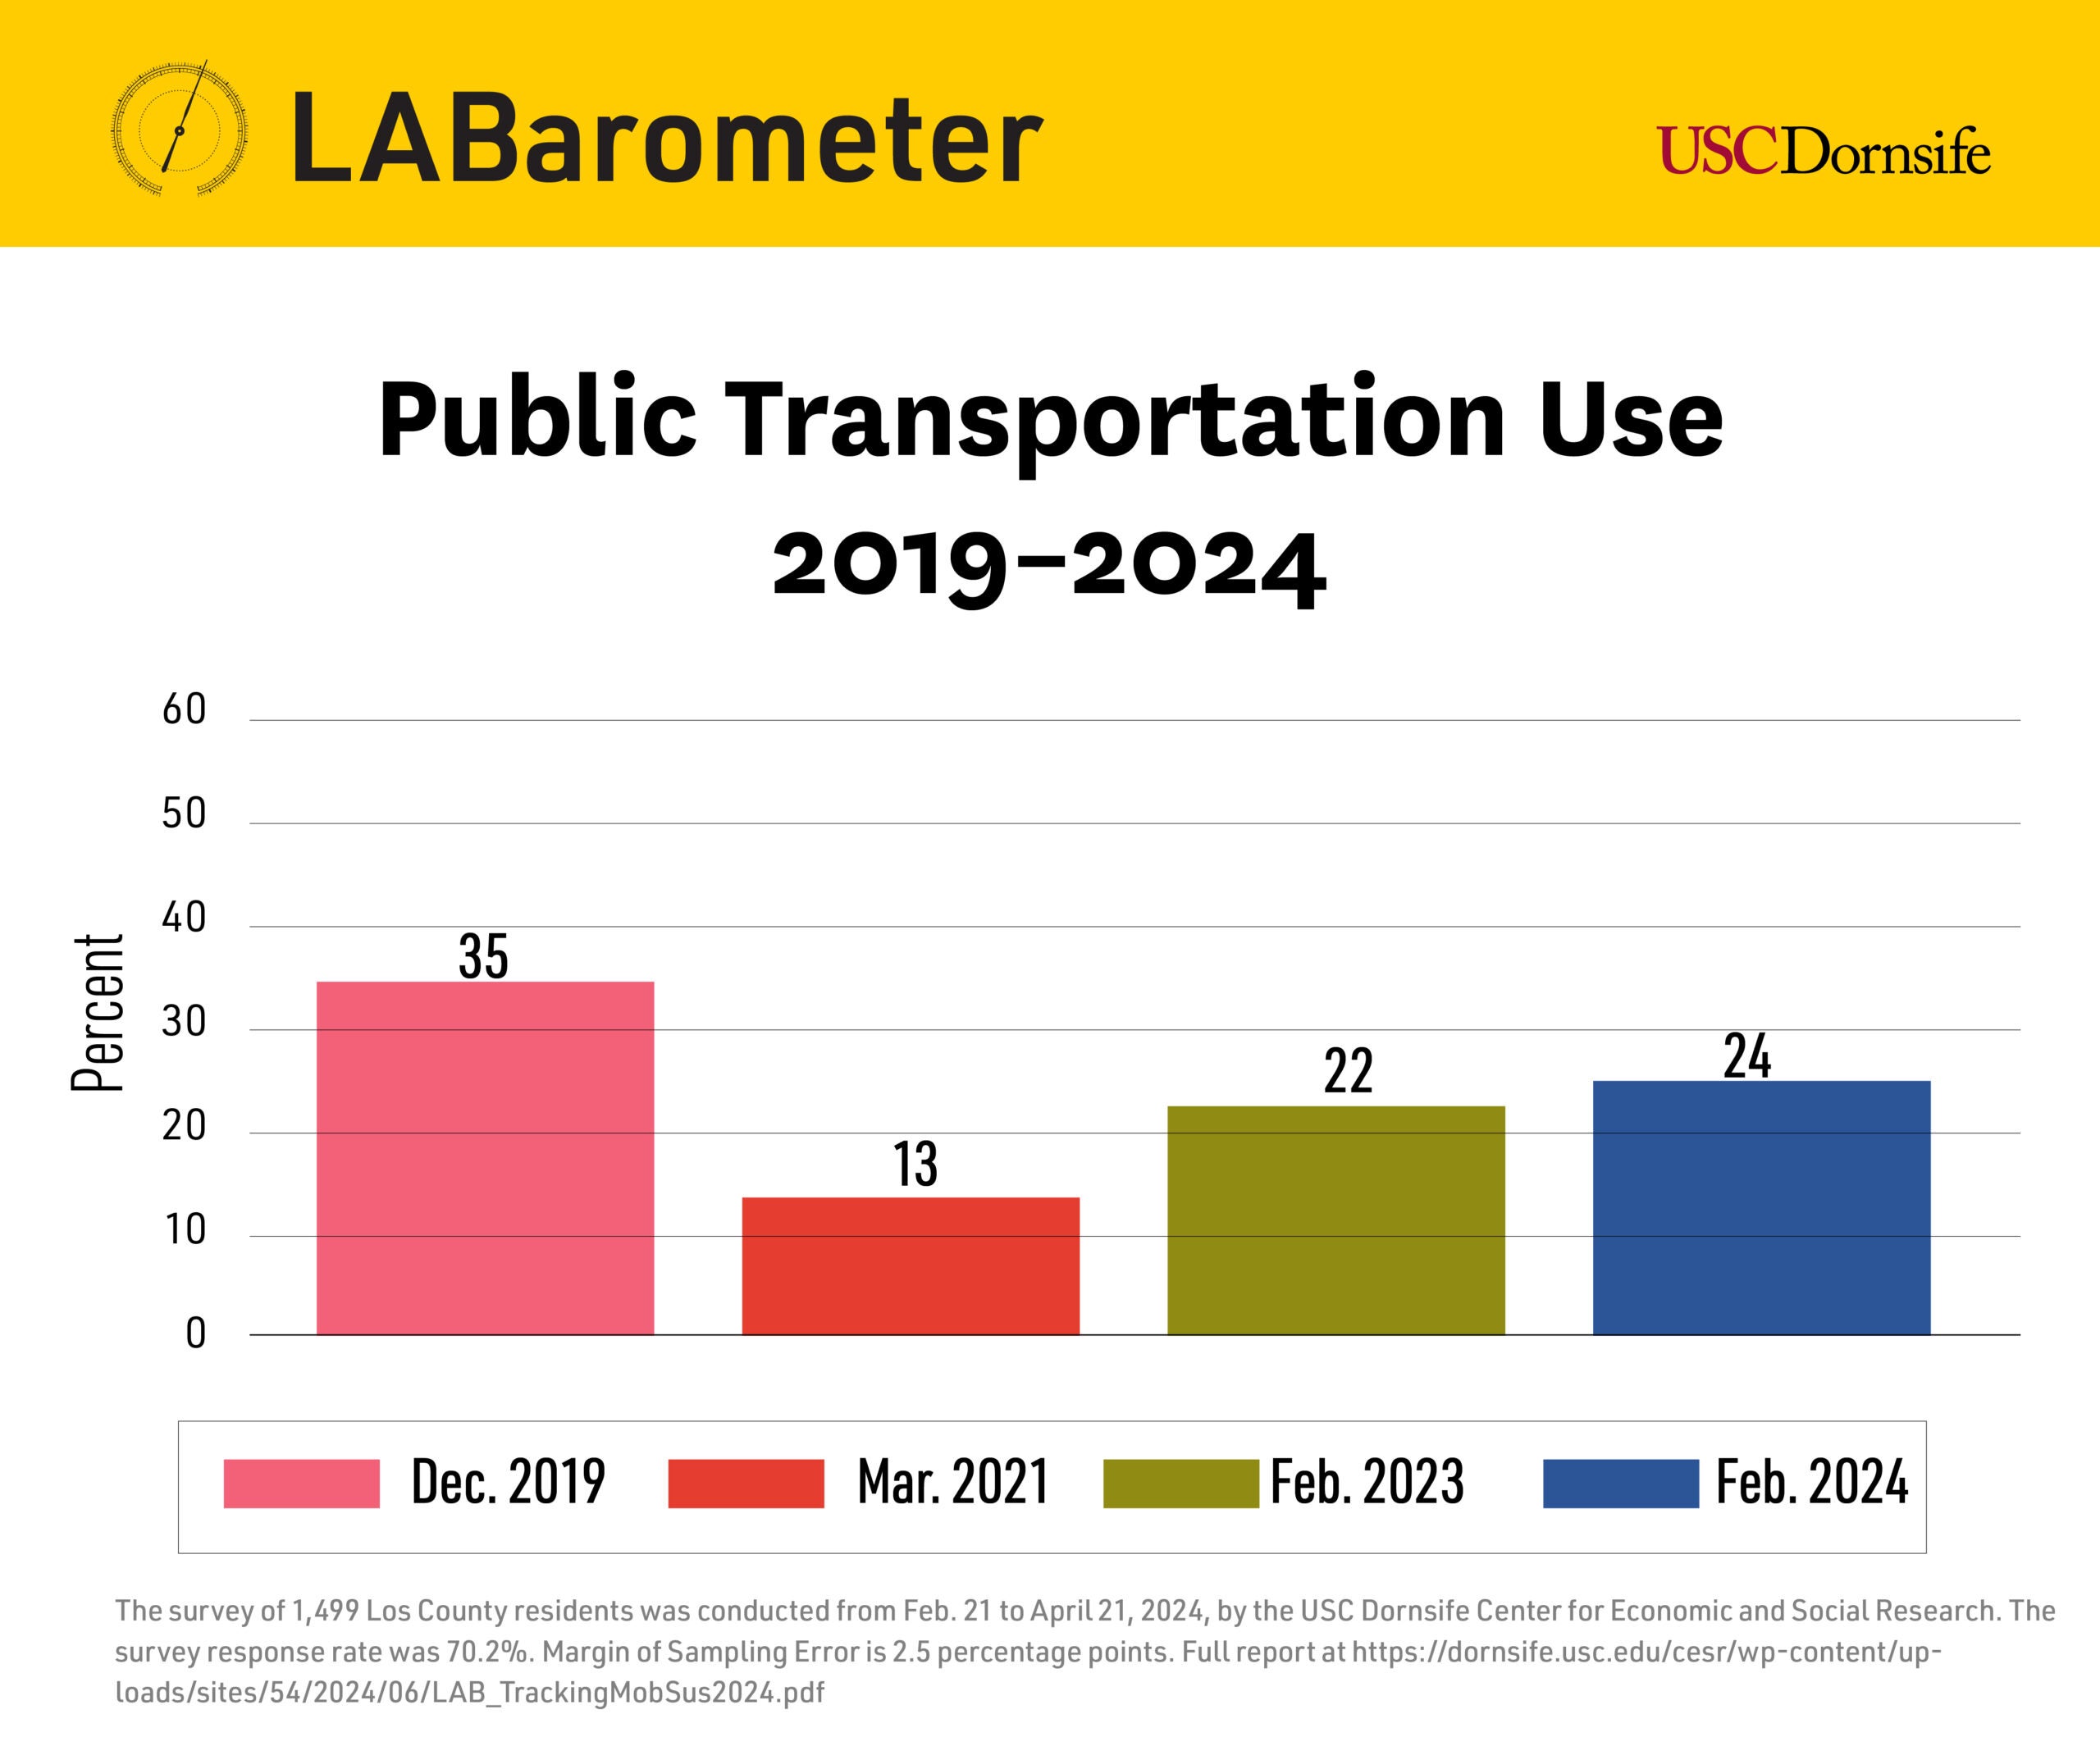
 As Jon Regardie wrote last year in Los Angeles Magazine, “Metro’s raison d’etre is to get hundreds of thousands of people each day across Southern California.” But the COVID-19 pandemic sent the numbers of riders plummeting to a low of 13%, and ridership still hasn’t fully rebounded.
The reason may now be clear, thanks to the latest USC Dornsife LABarometer survey, conducted by the Center for Economic and Social Research (CESR) at the USC Dornsife College of Letters, Arts and Sciences.
The survey found that although public transportation ridership in the county has nearly doubled since its low point in 2021, it remains below the pre-pandemic level of 35%.
The data shows that those who rode public transit before the pandemic but did not return to it after, dubbed “non-returning” riders, had a less favorable view of public transit compared to returning riders. Even before the pandemic, non-returning riders were less likely to see public transit as safe and convenient and often didn’t live near useful bus or metro stops. These people, typically occasional riders and car owners, were primed to leave public transit if given a reason.
What’s keeping people off transit and in their cars?
Safety on Metro transit has worsened since 2019. According to an ABC News report, violent crime on buses and trains and in stations increased by nearly 55% between 2020 and 2023. This could account for why the majority of both returning and non-returning riders do not perceive public transit as safe.
“According to our latest survey, safety does seem to be one of the driving forces keeping people from returning to public transportation post-pandemic, especially for higher-income residents who don’t absolutely need to use it,” said Kyla Thomas, sociologist at CESR and director of LABarometer.
Thomas noted that even though ratings of public transit safety among all riders have declined, especially regarding Metro trains, those who returned to public transit after the pandemic are more likely to perceive it as safe.
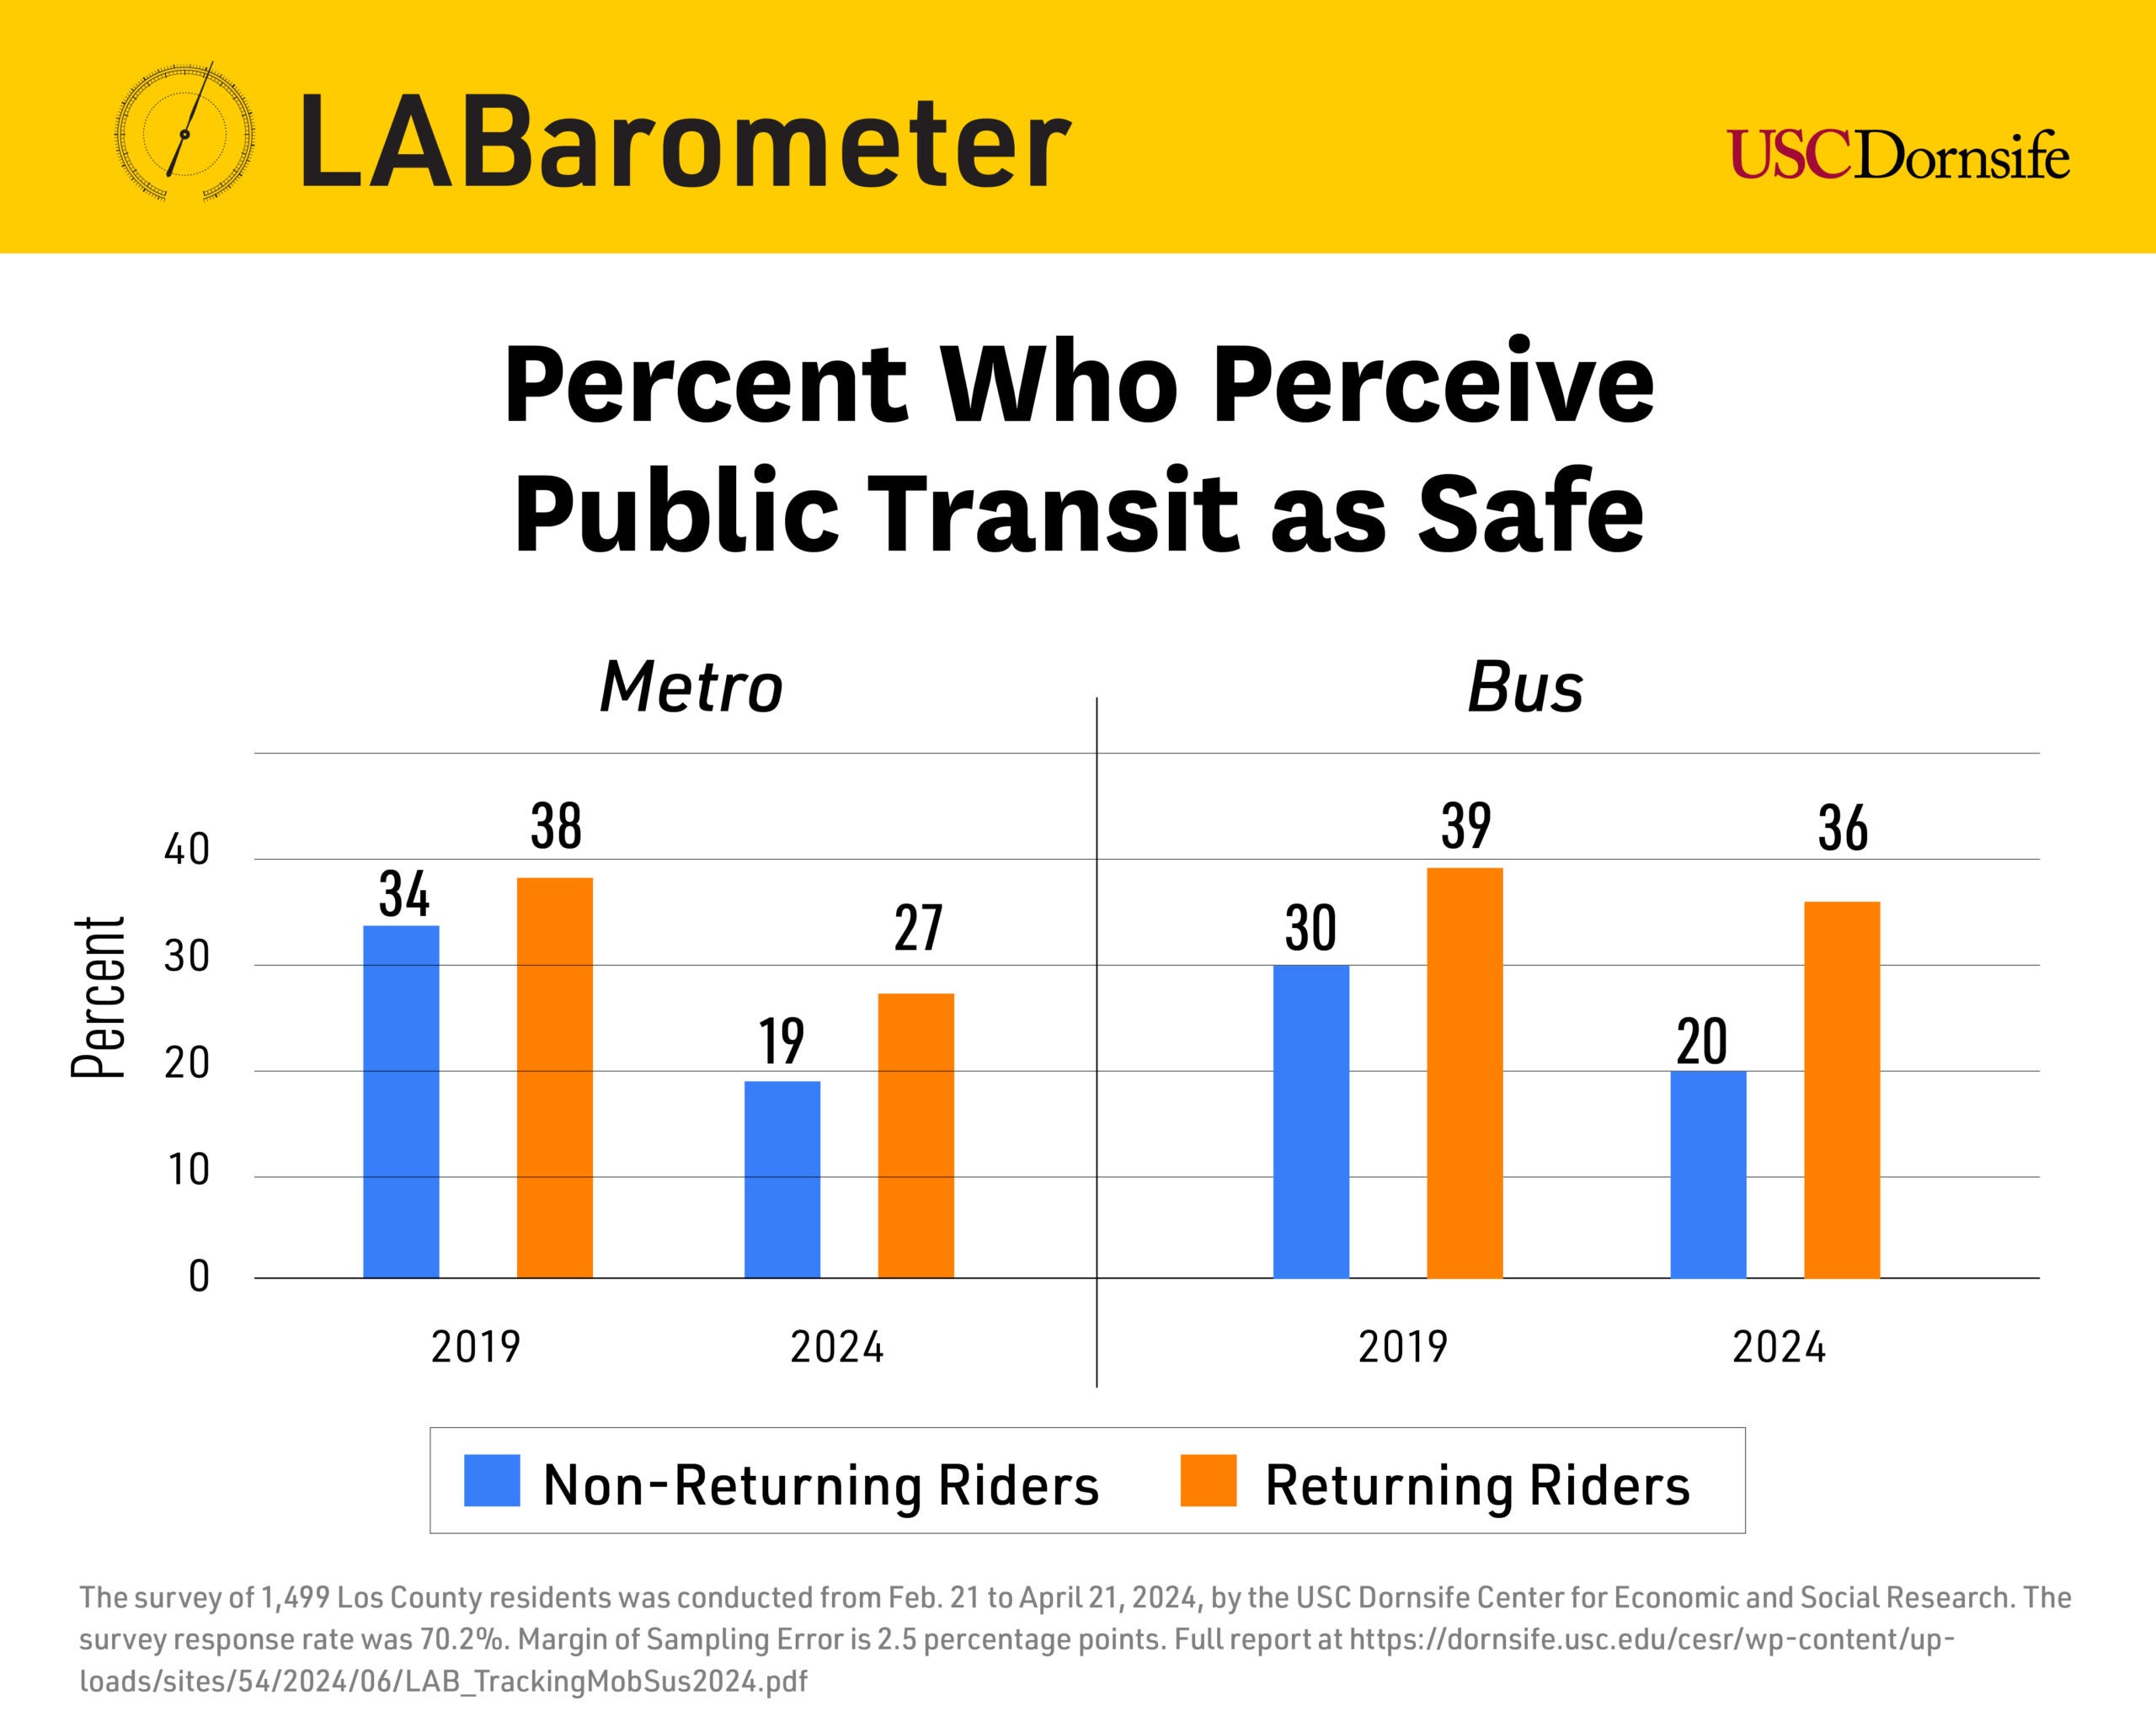
Further, the gap between how returning and non-returning riders perceive public transit safety has widened since 2019.Among non-returning riders, 44% fewer now perceive trains as safe compared to 2019. Among returning riders, 29% fewer feel it is safe.
In other words, 34% of non-returning Metro train riders thought it was safe in 2019 compared to only 19% today. Among returning riders, 38% thought it was safe in 2019, compared to only 27% today.
The survey also indicated that among non-returning bus riders, the number feeling safe dipped 33%, compared to just 8% among returning bus riders.
A recent L.A. Times editorial corroborated these findings: “Metro has had a public safety perception problem for a long time. In a 2016 survey, almost 30% of past riders said they left the system because they did not feel safe. Respondents said security and safety were bigger deterrents to using public transit than the speed and reliability of buses and trains.”
Convenience also matters
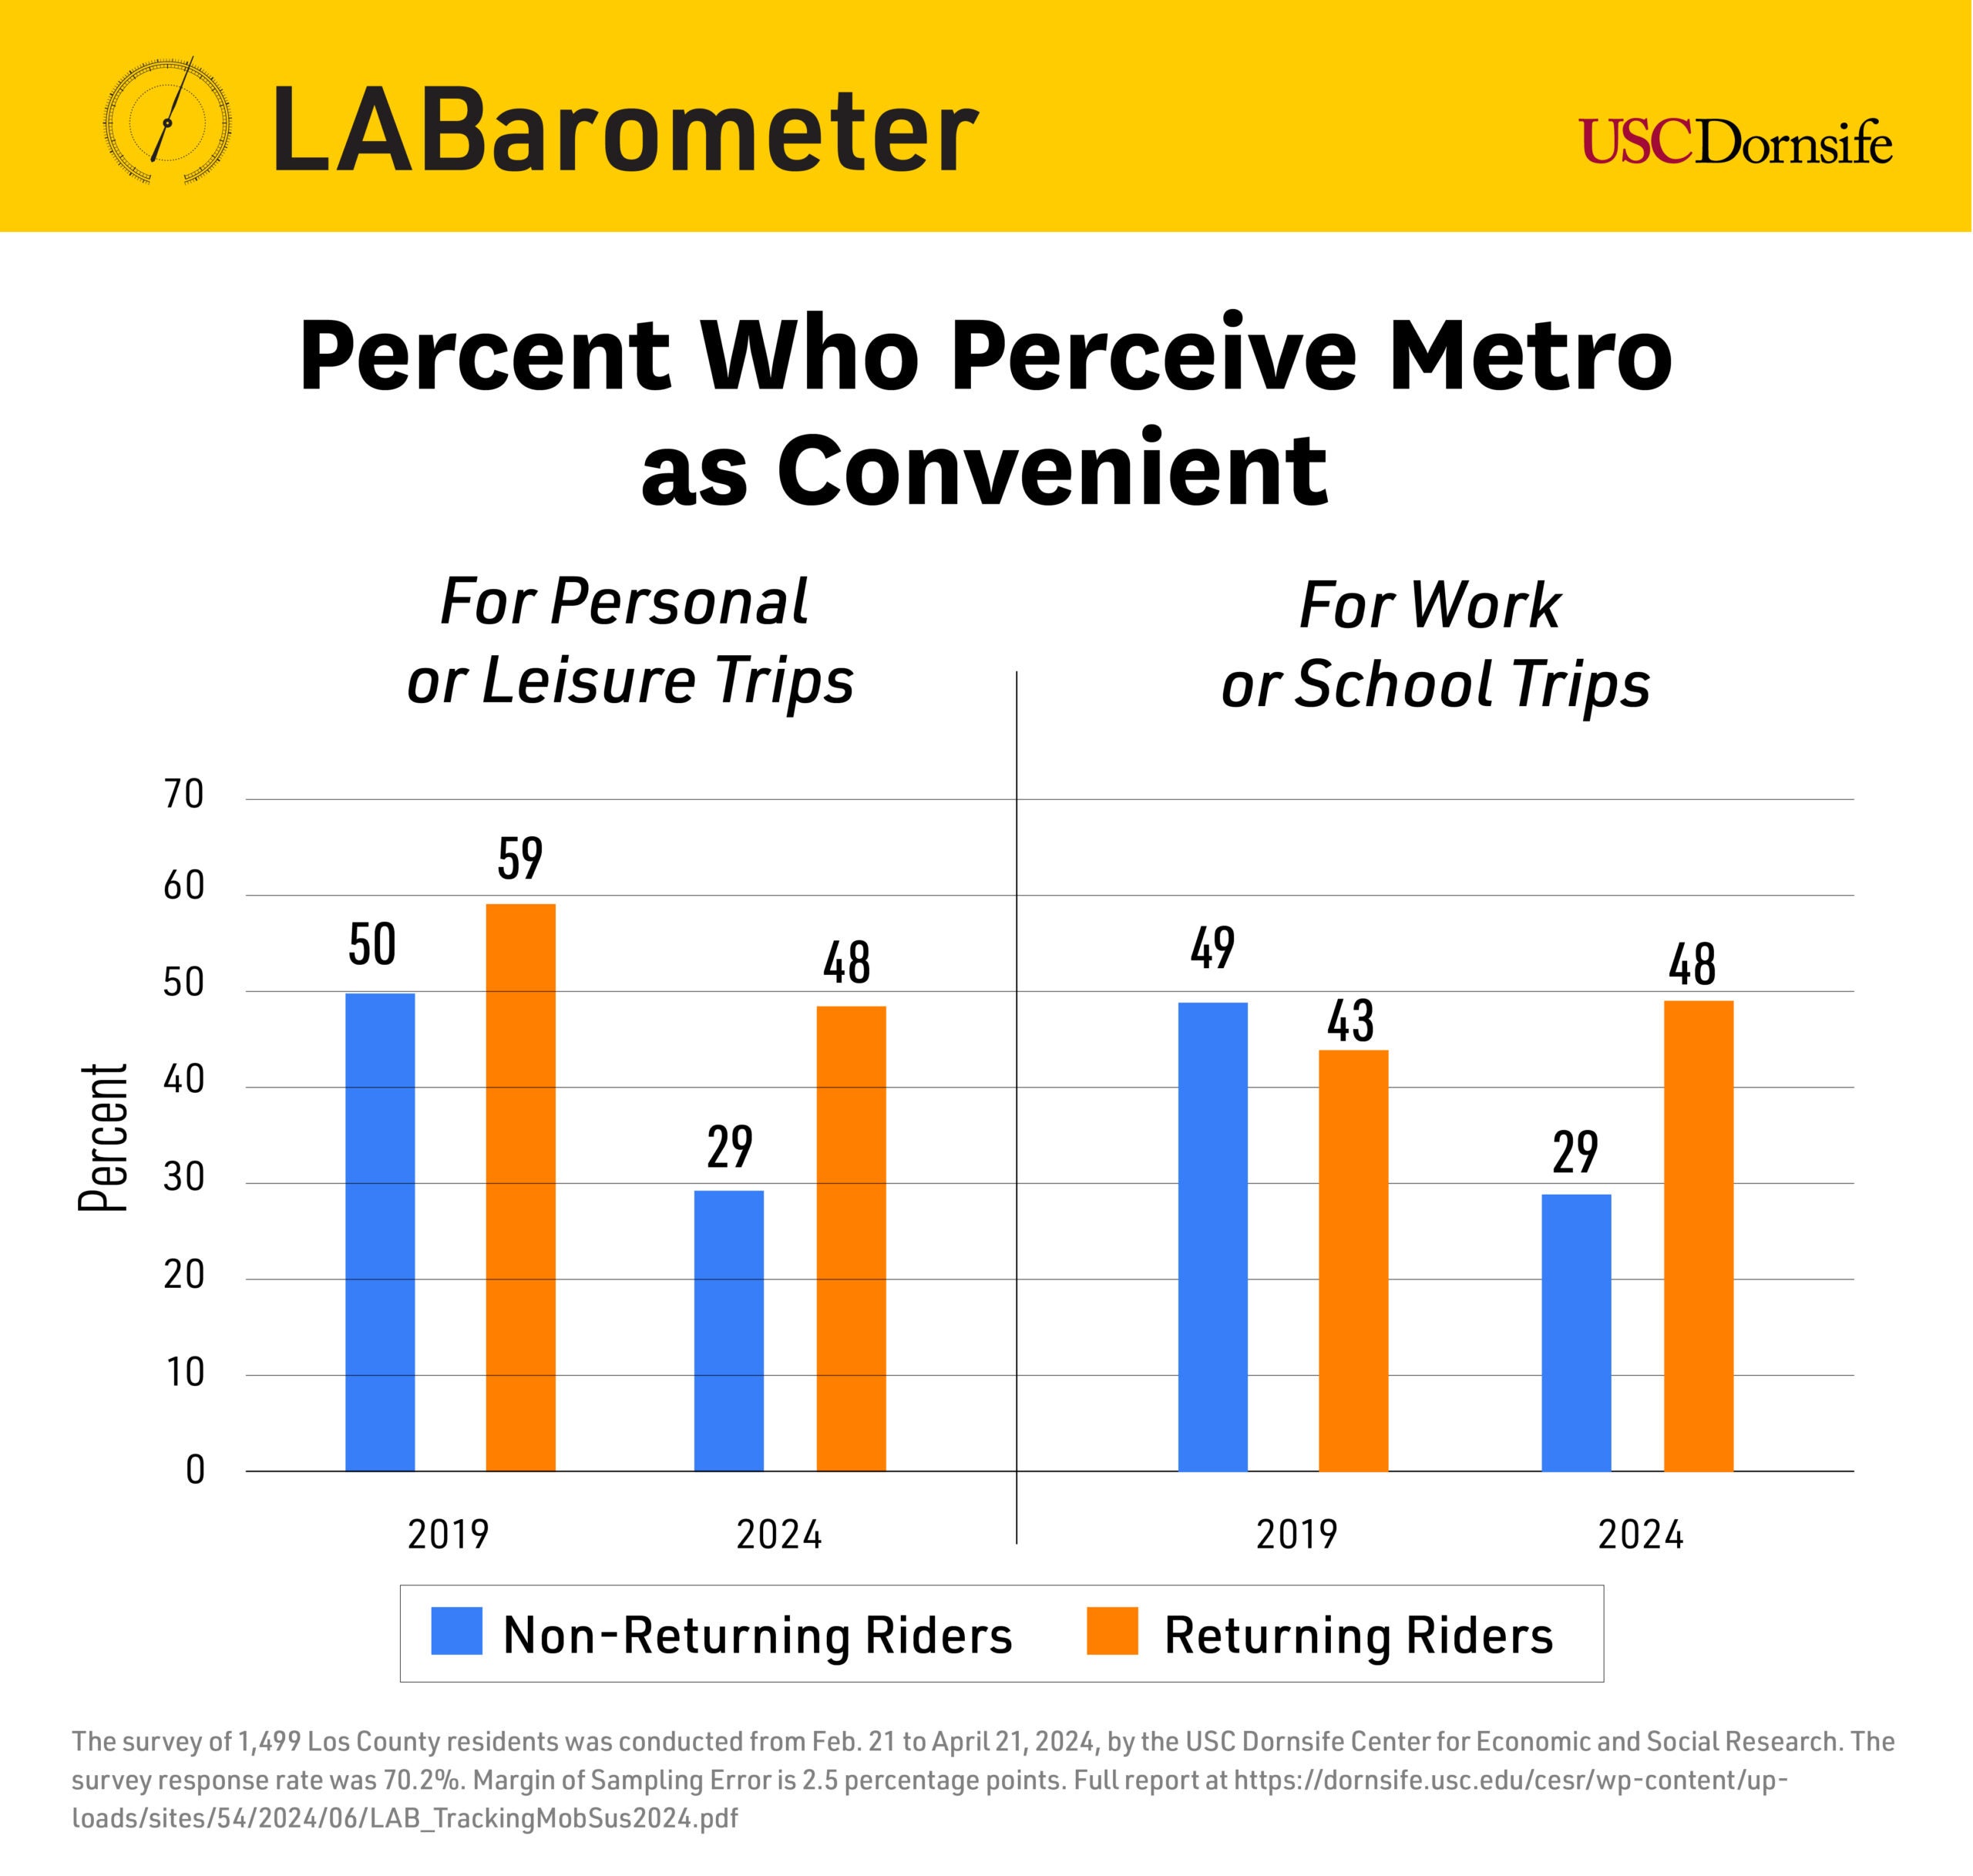
Convenience plays a significant role in whether people use buses and trains. For example, the researchers found that from 2019 to 2024, the number of non-returning riders who said Metro is convenient for personal and leisure trips decreased by 42%.
When the researchers compared perceptions of Metro’s convenience for work or school in 2019 versus 2024, they found 41% fewer non-returning riders found it convenient. There was little change among returning riders.
Why do people take transit?
Inflation might be hurting wallets these days, but most people still find Metro to be a good deal, the researchers noted. Keeping fares level for the bus and rail has enticed those who earn less than $30,000 per year to keep riding. The survey showed that about half of these low-income residents who rode the bus or train in 2019 still use it.
Yet, low ticket prices, inflation and high gas prices have not yet enticed high-income earners to return to public transit. Only a quarter of those earning over $100,000 annually who rode in 2019 are riding again.
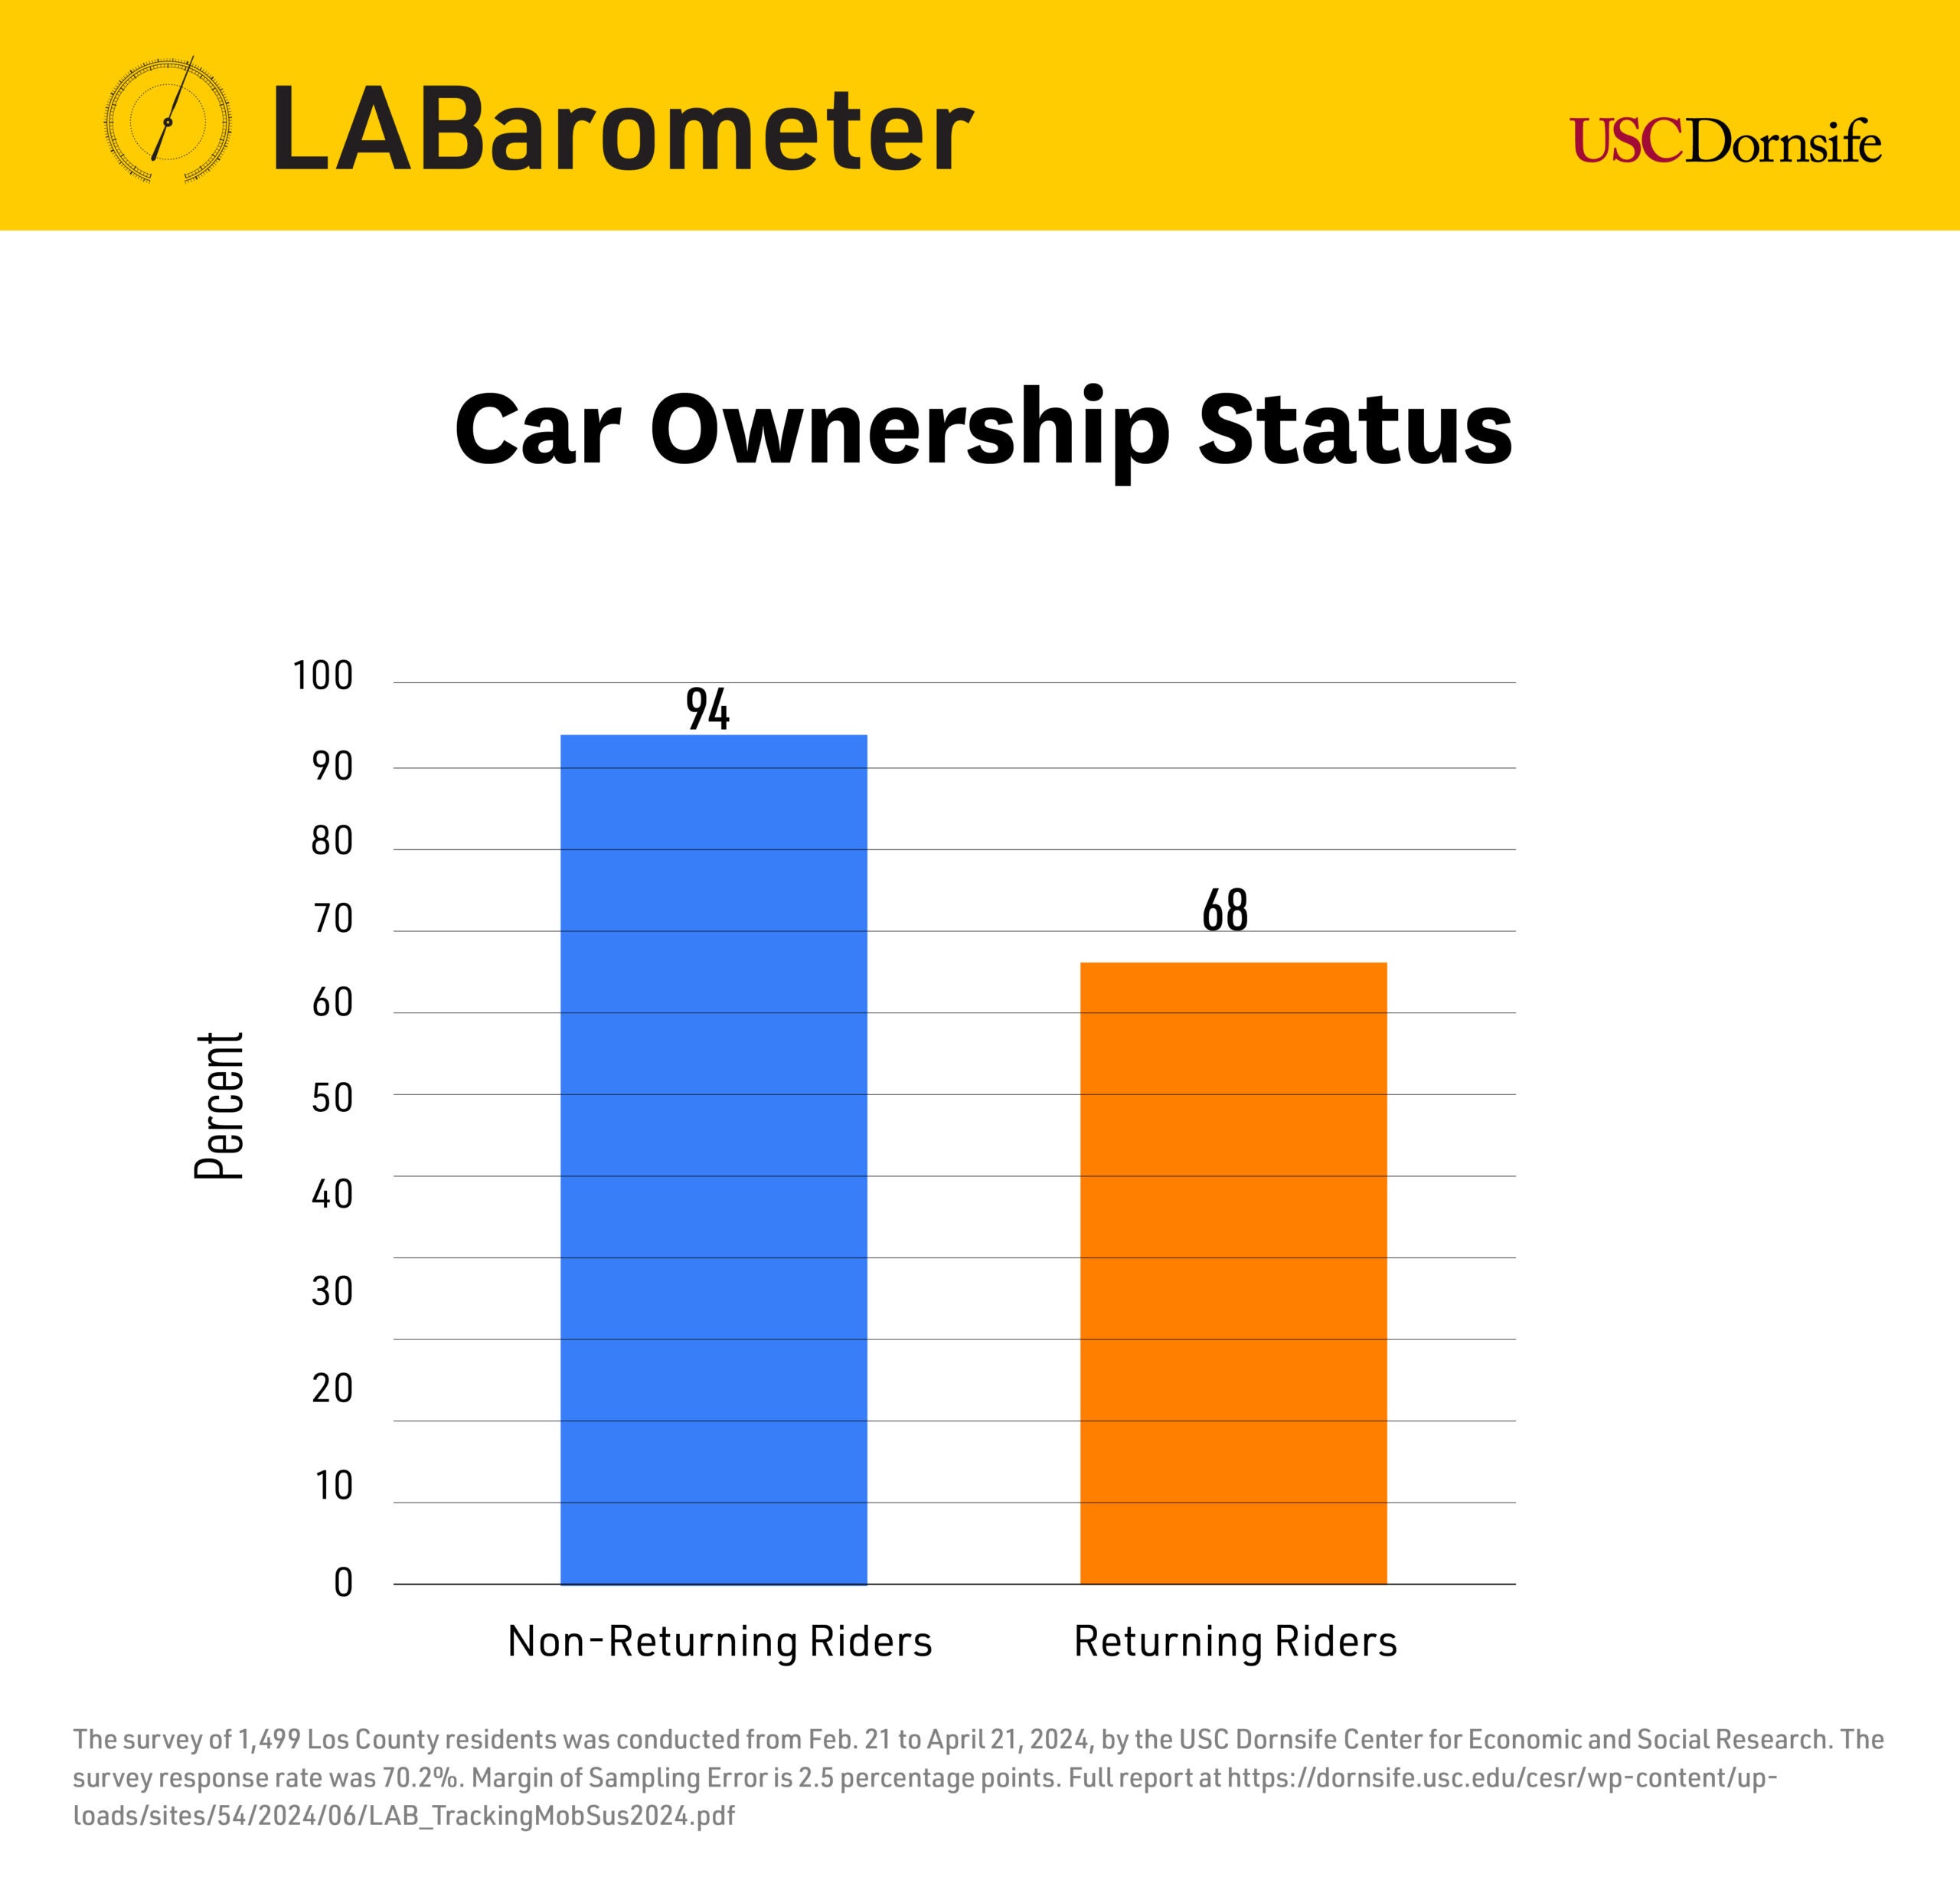
Car ownership plays into this economic divide. Just 68% of returning riders own a car compared to a whopping 94% of non-returning riders.
Returning riders used public transit more for daily commutes and errands in 2019, while non-returning riders, most of whom own cars, used buses and trains more for occasional trips like airport commutes and leisure activities. Today, the percentage of people relying solely on private vehicles for commuting and leisure activities has increased since before the pandemic. In 2019, 33% of residents depended only on their cars. Today, that figure has jumped to 45%.
“These non-returning riders will be tough to lure back onto public transit. So many of them have cars they rely heavily on. Then again, these former riders never used public transit because they lacked means. Improvements in safety and convenience could bring them back,” Thomas said.
The wallet drives sustainability choices
As it does in public transit ridership, economics plays a key role in whether people invest in green technologies, like electric vehicles (EV) or solar panels for their homes, according to the survey. Financial means and incentives like tax credits rather than environmental concerns appear to be driving these decisions.
Interestingly, residents who own solar panels or EVs are no more likely to engage in other sustainable behaviors, such as recycling or limiting water usage, than non-owners. Residents who own solar panels are also slightly less likely to perceive climate change as a human-caused threat or to believe in the effectiveness of individual actions in combating climate change.
Regardless of motive, EV ownership has skyrocketed by 74% since 2023 and nearly 300% since 2020, according to the survey. Solar panel installations have increased by 25% from 2023 to 2024. This growth is predominantly among young, wealthy, white, and Asian residents.
“The data shows that a lot of people aren’t doing this out of the goodness of their heart or to fight climate change — that’s not really what seems to be driving their behavior,” said Thomas. “But, if financial incentives can push people toward investing in energy-efficient cars and solar panels, I think that’s positive news.”
About the survey
LABarometer is a biannual, probability-based internet survey of more than 2,000 Los Angeles County adults, designed and administered by the USC Dornsife Center for Economic and Social Research. It tracks the same participants over time to capture trends and shifts in their attitudes and circumstances.
This survey on mobility and sustainability was conducted Feb. 21 to April 21. Read the full report.