National Equity Atlas
Partnership

The National Equity Atlas is America’s most detailed report card on racial and economic equity. We equip movement leaders and policymakers with actionable data and strategies to advance racial equity and shared prosperity. The Atlas is produced by PolicyLink and the USC Equity Research Institute (ERI).
The National Equity Atlas is a first-of-its-kind data and policy tool for the community leaders and policymakers who are working to build a new economy that is equitable, resilient, and prosperous. It is a comprehensive resource for data to track, measure, and make the case for racial equity and inclusive prosperity in America’s regions, and states, and nationwide. The Atlas contains data on demographic change, racial and economic inclusion, and the potential economic gains from racial equity for the largest 100 cities, 430 large counties, the largest 150 regions, all 50 states, and the United States as a whole.
PolicyLink and USC Equity Research Institute (formerly the Program for Environmental and Regional Equity) built the Atlas to equip community leaders and policymakers with the facts and analyses needed to:
- Understand how your community’s demographics are changing;
- Assess the state of equity in your community, based on how well your community’s diverse populations can participate in its economic vitality, contribute to its readiness for the future, and connect to its assets and resources;
- Build a compelling narrative and shared understanding about why—and how much—equity matters; and
- Inform the development of policies, plans, strategies, business models, and investments to advance equitable growth.
We democratize data and make it easy for you to understand, discuss, and use. Explore the Atlas to find:
- A holistic Racial Equity Index that provides a snapshot of how your community is doing on equity compared to its peers across nine key indicators;
- Customizable charts, graphs, and maps to share with your colleagues and on social media and add to your presentations, fact sheets, reports, and funding proposals;
- Stories about how local leaders are using equity data to catalyze new conversations and win new policies and investments in equity solutions; and much more!
The Atlas is a living resource, and we add new data and analyses on a regular basis.
More about the National Equity Atlas
Racial Equity Data Lab
The Racial Equity Data Lab is a space on the National Equity Atlas where you can create data visuals and dashboards to support your campaigns for racial equity and inclusive recovery.
Through the Lab, you can learn how to make powerful equity visuals. Clear and compelling data is essential to advancing equity campaigns. Learn how to design dashboards that make the case for equity and support transformative policy change in your community.
Explore starter workbooks that provide National Equity Atlas datasets in a Tableau-ready format. Each workbook includes data for all of the geographies in the Atlas (the United States, all 50 states, the 150 largest metropolitan areas, and the 100 largest cities), breakdowns by race, sex, nativity, gender, and ancestry, and example charts you can use to create your own custom displays.
- Explore the data by reviewing charts.
- Customize your charts by adjusting the visual design of a chart using a different color palette, layout, or any other chart elements. Add in callouts or tooltips to highlight key data points most relevant to you.
- Create your own Tableau dashboard or story highlighting multiple data charts most relevant for your needs. Bring in your own community’s experience and context on the drivers of inequity, and create a dashboard with policy solutions to improve equity.
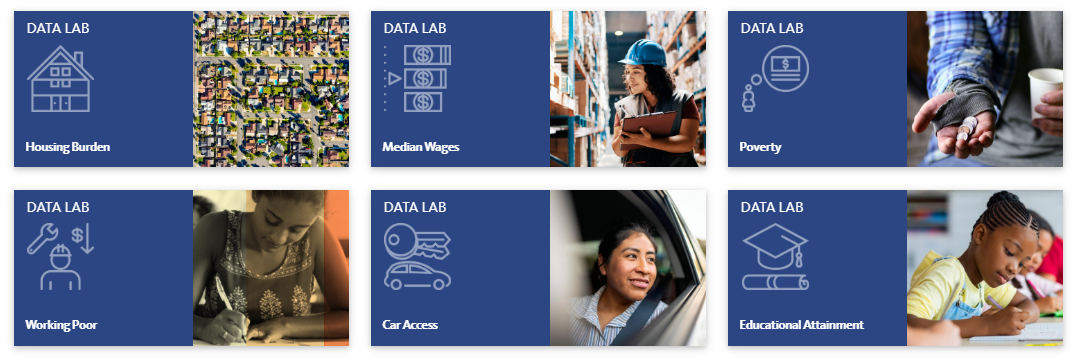
Get started now with the workbooks for Housing Burden, Median Wages, Poverty, Educational Attainment, Car Access, and Working Poor. We will continue to add workbooks for the rest of the Atlas indicators on a rolling basis.
Bay Area Equity Atlas

The Bay Area Equity Atlas is a comprehensive data support system launched in June 2019 to track the state of equity across the region and equip community leaders with data to inform solutions for inclusive prosperity. The Atlas is produced by the San Francisco Foundation, PolicyLink, and the USC Equity Research Institute (formerly known as PERE, the Program for Environmental and Regional Equity at USC).
The Bay Area region is at a crossroads. Our economy is one of the strongest on the planet, yet inequality is skyrocketing amidst persistent racial inequities, climate change is placing our future at risk, and we face a housing and displacement crisis that has hit low-income communities of color the hardest but has had a ripple effect throughout the region. Amidst this confluence of challenges, equity — just and fair inclusion — is both a moral imperative and an economic necessity. Addressing systemic racism and discrimination, and putting in place the policies, business models, and programs that remove barriers and ensure all Bay Area residents can participate and thrive is our region’s path to inclusive prosperity.
The Bay Area Equity Atlas is a tool for community leaders seeking to create a more equitable, sustainable, and resilient region. Robust, disaggregated data is critical to informing action strategies for equitable growth. Despite the rich data and technology resources in the Bay Area, community leaders have lacked access to the data they need to drive solutions forward. The Bay Area Equity Atlas aims to fill this gap.
PolicyLink, USC ERI, and the San Francisco Foundation built the Atlas to accomplish the following goals:
- Build a shared understanding about the importance of equity to the region’s future
- Provide a set of powerful equity metrics that are disaggregated by race and other demographics to support more informed decision-making
- Inform solutions for equitable growth by sharing effective and promising strategies
- Democratize data and make data more accessible
- Increase the capacity of change-makers and advocates to use data to advance policy solutions
Related Publications
Explore equity profiles of various regions across the country, research briefs, and analyses from 2011 to present.