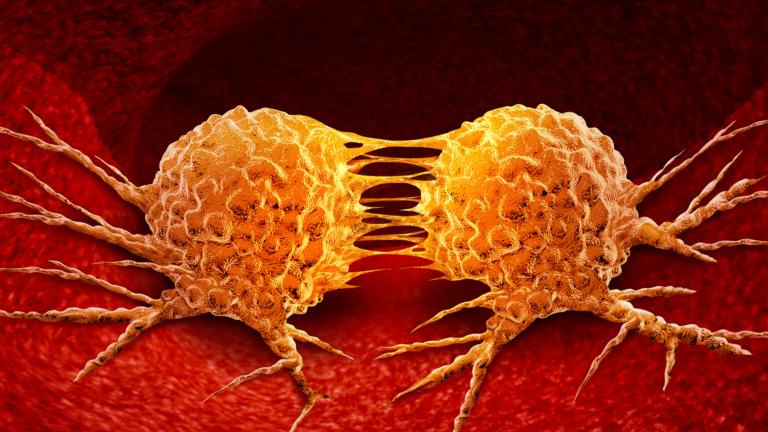
Sustainability: Human Factors
RESEARCH SPOTLIGHT
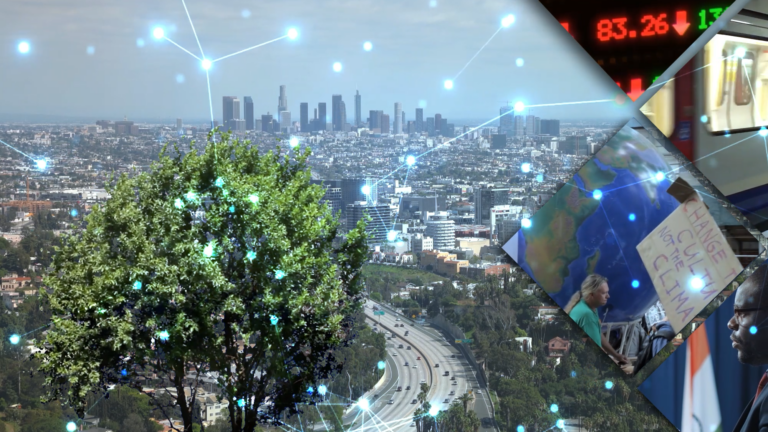
Effective technology is available to move the needle on sustainability. The challenge is to implement these solutions quickly and at scale.
That’s why USC Dornsife is thinking differently. Our researchers explore how to overcome the economic, political, and psychological challenges that stand in the way of a sustainable future.

USC Dornsife faculty and alumni featured at 2024 LA Times Festival of Books
This weekend, the nation’s largest book festival descends once again on Troy, featuring USC Dornsife scholars and graduates.
Alumnus Jaren Lewison, Star of ‘Never Have I Ever,’ to Deliver 2024 USC Dornsife Commencement Address
Lewison, who portrayed Ben Gross in the popular Netflix series while studying psychology, will speak during the College’s graduation ceremonies — and receive the USC Dornsife Distinguished Alumni Medallion — on May 10.

Celebrating the Class of 2024
Find everything you need to know about USC Dornsife Commencement Ceremonies on Friday, May 10, 2024.


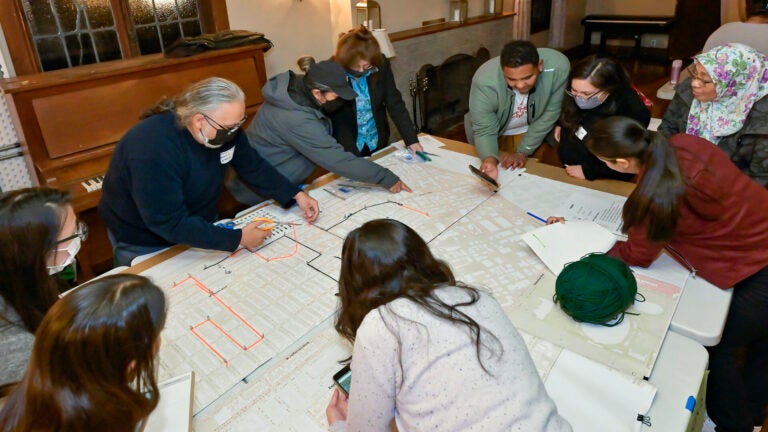
Ancient Canoe Revival Highlights Indigenous Sustainability Practices and Ocean Conservation
The first Tongva “ti’at” built in centuries finds a permanent exhibit and helps highlight Native American sustainable maritime traditions.
Curiosity at Work


Stand Out, Together
At USC Dornsife you’ll study the things you love the most. You’ll explore ideas that you’ve never thought about before. You’ll learn how to make sense of the world from all different angles. And, as part of our community, you will help to define a dynamic academic environment focused on improving lives and the world around us.
Meet the Students
USC Dornsife students demonstrate an impressive combination of academic excellence, accomplishment, creativity, and hard work. Each and every student is hand-selected because they bring something special and unique to our community.
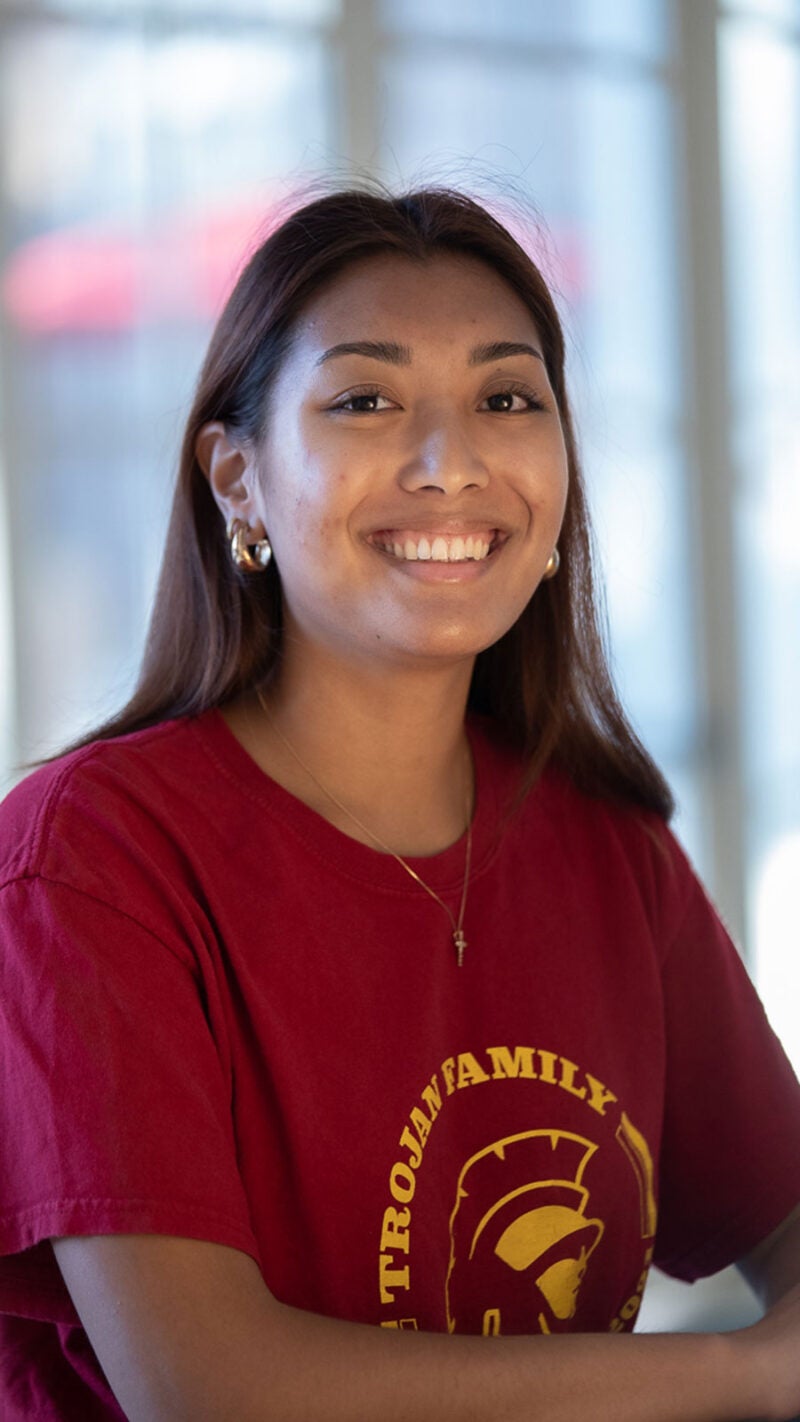
A Brighter Future
Isabella Pangilinan Environmental Studies majorUSC Dornsife student Isabella Pangilinan is passionate about finding solutions to some of our world’s most pressing challenges like climate change and social and economic inequity. The multidisciplinary courses offered through her major are preparing her for a career in environmental law.
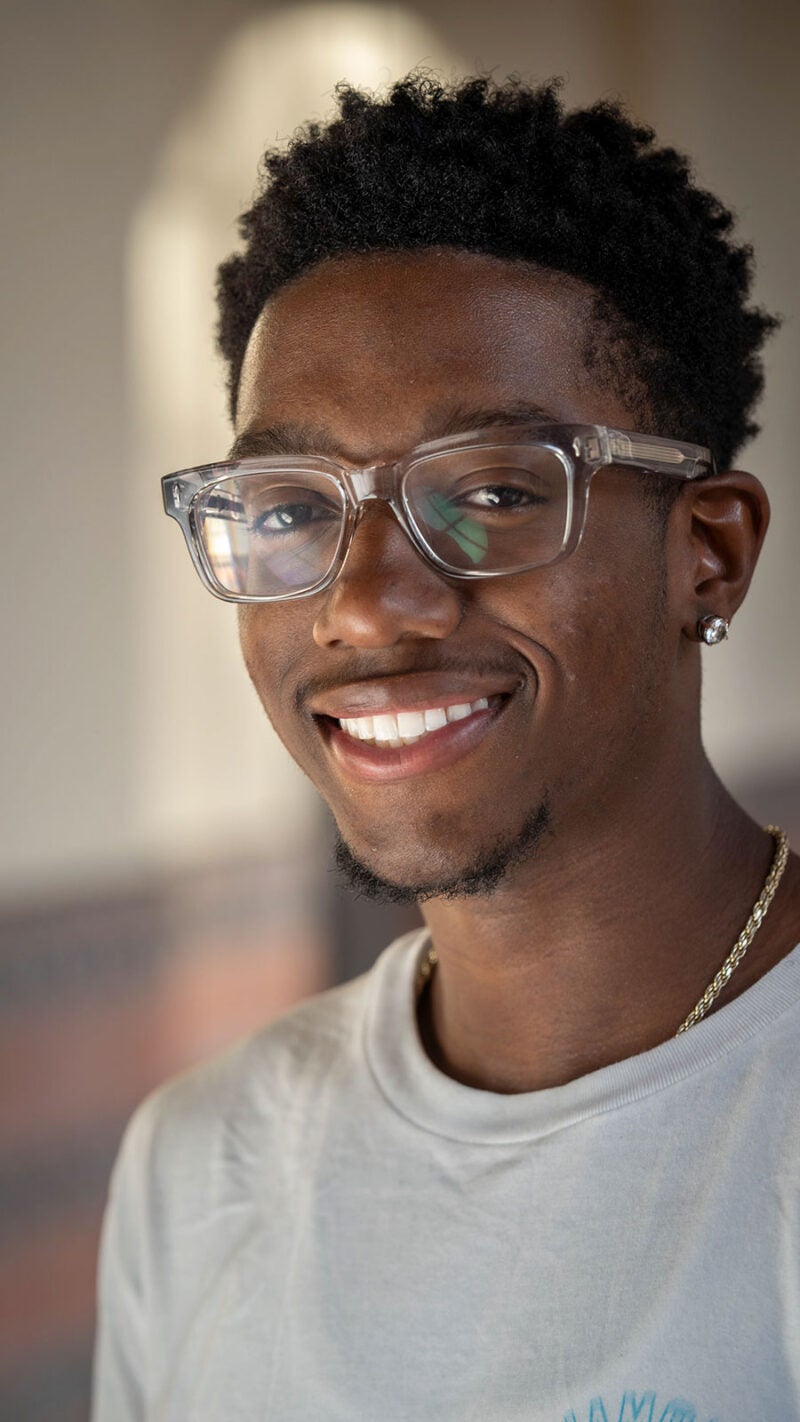
The Power of “And”
Joshua Senior Biological Sciences major, East Asian Languages and Cultures minorUSC Dornsife student Joshua Senior is studying to become a neurosurgeon. He explains how his liberal arts education at USC Dornsife prepares him for his career goals – and for life.
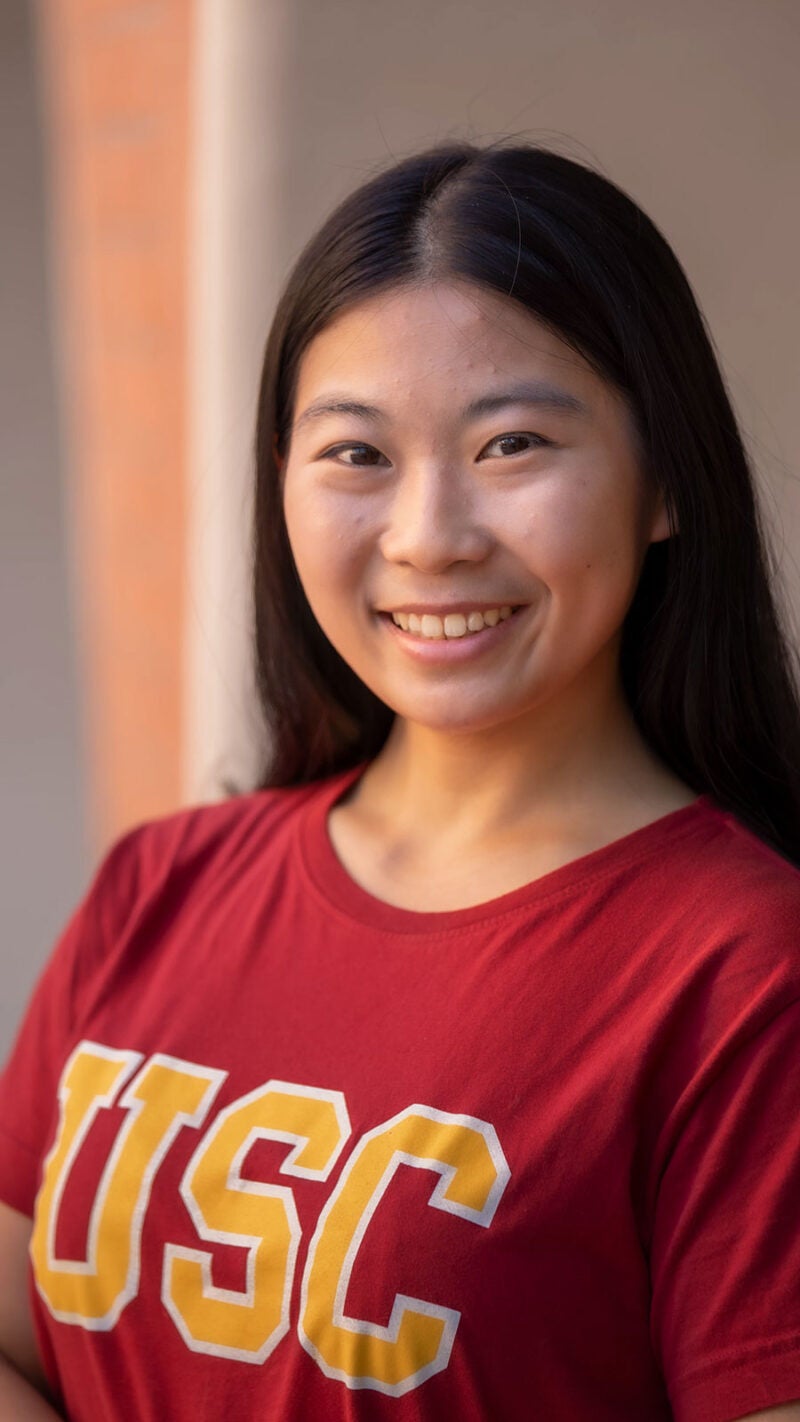
A Trojan Family Like No Other
Victoria Quon-Chow Human Biology major, Nutrition and Health Promotion minorAs a student at USC Dornsife, Victoria Quon-Chow is bouyed by the support of the Trojan Family as she prepares to become a doctor.
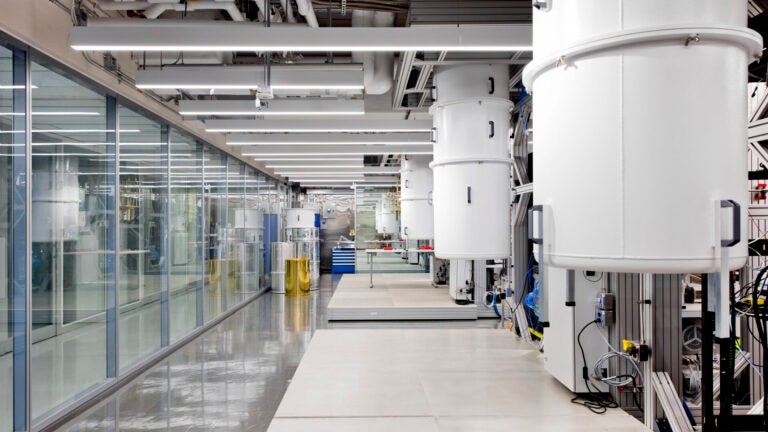
Unprecedented Access to Academic Expertise
Public Exchange fast-tracks collaboration between academic researchers and the public and private sectors to define, analyze, and solve complex problems that organizations face. Through our first-of-kind model, we amplify social impact by making academic expertise more easily accessible than ever before.
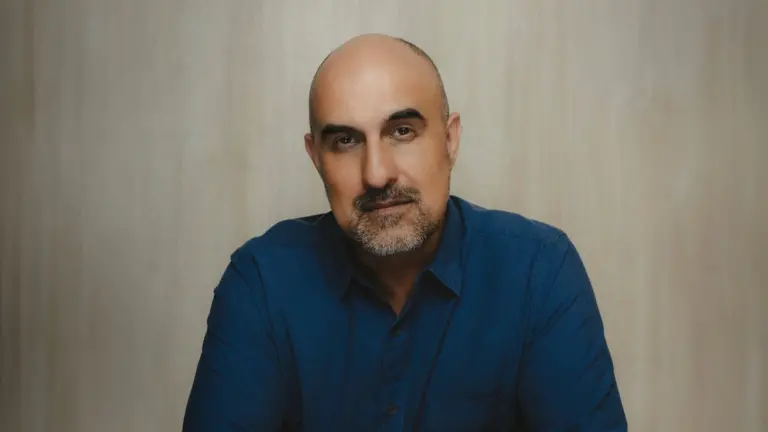
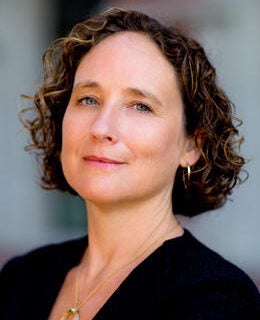
“Public Exchange provides the connective tissue that not only identifies appropriate expertise within the university to solve a particular problem, but it takes care of the contracts, project management, and other hurdles that have traditionally made collaboration with researchers challenging.”
Stand Out With Purpose


USC Dornsife’s Public Exchange creates streamlined pathways for public and private sector leaders to tap academic expertise. This model accelerates solutions to challenging social and environmental problems and enhances the social impact of academic research.

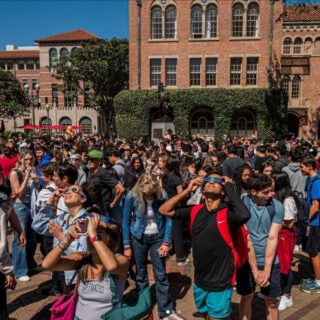
@USCDornsife
Hundreds of Trojans came out to view the eclipse safely with a little help from @uscphysics!! 🌞 🌝