 Circular dichroism spectroscopy is used to gain information about the secondary structure of biopolymers: nucleic acids, proteins, and polypeptides in solution.
Circular Dichroism is observed when optically active matter absorbs left and right hand circular polarized light slightly differently.
Figure 1 (a) Linear polarized light can be viewed as a superposition of opposite circular polarized light of equal amplitude and phase. (b): different absorption of the left- and right hand polarized component leads to ellipticity (CD) and optical rotation (OR). The actual effect is minute and using actual numbers the ellipse would still resemble a line.
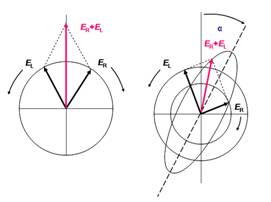 Linear polarized light can be viewed as a superposition of opposite circular polarized light of equal amplitude and phase. A projection of the combined amplitudes perpendicular to the propagation direction thus yields a line (figure 1a). When this light passes through an optically active sample with a different absorbance A for the two components, the amplitude of the stronger absorbed component will smaller than that of the less absorbed component. The consequence is that a projection of the resulting amplitude now yields an ellipse instead of the usual line (draw on a sheet of paper and check). Note that the polarization direction has not changed. The occurrence of ellipticity is called Circular Dichroism.
Circular Dichroism Spectroscopy Is Particularly Good for:
- determining whether a protein is folded, and if so characterizing its secondary structure, tertiary structure, and the structural family to which it belongs
- comparing the structures of a protein obtained from different sources (e.g. species or expression systems) or comparing structures for different mutants of the same protein
- demonstrating comparability of solution conformation and/or thermal stability
- studying the conformational stability of a protein under stress ― thermal stability, pH stability, and stability to denaturants ― and how this stability is altered by buffer composition or addition of stabilizers and excipients. CD is excellent for finding solvent conditions that increase the melting temperature and/or the reversibility of thermal unfolding, conditions which generally enhance shelf life
- determining whether protein-protein or protein-ligand interactions alter the conformation of protein. If there are any conformational changes, this will result in a spectrum which will differ from the sum of the individual components. Small conformational changes have been seen, for example, upon formation of several different receptor/ligand complexes.
Determination of Protein Secondary Structure by Circular Dichroism:
 Secondary structure can be determined by CD spectroscopy in the “far-UV” spectral region (190-250 nm). At these wavelengths the chromophore is the peptide bond, and the signal arises when it is located in a regular, folded environment.
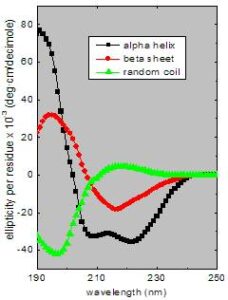
Alpha-helix, beta-sheet, and random coil structures each give rise to a characteristic shape and magnitude of CD spectrum.This is illustrated by the graph to the right, which shows spectra for poly-lysine in these three different conformations.
The approximate fraction of each secondary structure type that is present in any protein can thus be determined by analyzing its far-UV CD spectrum as a sum of fractional multiples of such reference spectra for each structural type.
Like all spectroscopic techniques, the CD signal reflects an average of the entire molecular population. Thus, while CD can determine that a protein contains about 50% alpha-helix, it cannot determine which specific residues are involved in the alpha-helical portion.
Far-UV CD spectra require 150 µl of solution (1 mm cuvette) containing 50 µg/ml and up protein, in any buffer which does not have a high absorbance in this region of the spectrum. (High concentrations of DTT, histidine, or imidazole, for example, cannot be used in the far-UV region.) Note that for many formulated protein samples the absorbance due to the excipients prevents collecting spectra below 200 nm (and even 200 nm is often not possible). When that is true the accuracy reliability of secondary structure calculations (the actual percentages of different structures) is compromised, but the validity of spectral comparisons is not.
More information on the CD applications for determining protein structure can be found at http://www.ap-lab.com/circular_dichroism.htm
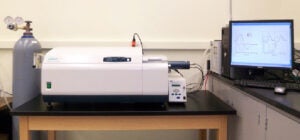
Specifications for the J-815 Circular Dichroic Spectrometer
Light Source: 150 W air-cooled Xenon Lamp
Detector: Head-on photomultiplier tube
Wavelength Range: 163 to 900 nm
Digital Integration Time (D.I.T.): 0.5 msec to 32 sec
Scanning System: Continuous scan or Step scan (Fixed D.I.T. and auto D.I.T. setting)
Scanning Speed: Up to 10000 nm/min (continuous scan)
CD Full Scale: ±10, 200, 2000 mdeg
Stray Light: Not more than 0.0003% at 200 nm
Baseline Stability: 0.03 mdeg/hr
Temperature Control: Single position Peltier thermostatted cell holder for rectangular cells with a maximum light path length of 10 mm with temperature setting range of -10 to +110°C.